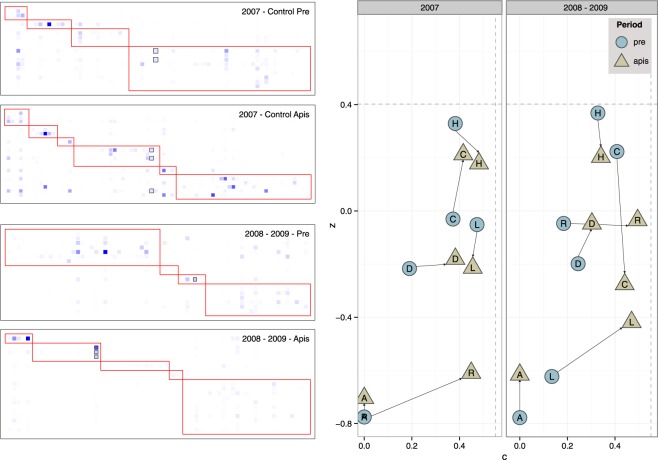
Figure 2.
Modules (left) and species roles (right) for the control year (2007) and 2008–2009 combined. Species are sorted according to their assignment to modules, plants as rows and pollinators as columns. Darker squares indicate more frequent interactions. Squares with black outlines indicate honeybee. Trends in the topological role of pollinator species (right; pooled by Order) through pre- and apis-periods for the control-year (2007) and 2008–2009 combined. Roles are indicated by c, the fraction of interactions involving species in different modules, and z, the fraction of interactions with species in the same module. Dashed lines indicate the 0.95 percentile threshold values estimated on the species-specific data. H: Hymenoptera; C: Coleoptera; D: Diptera; R: Reptiles; L: Lepidotera; A: Aves. See species identities and results per pollinator species in Supplementary Information.

