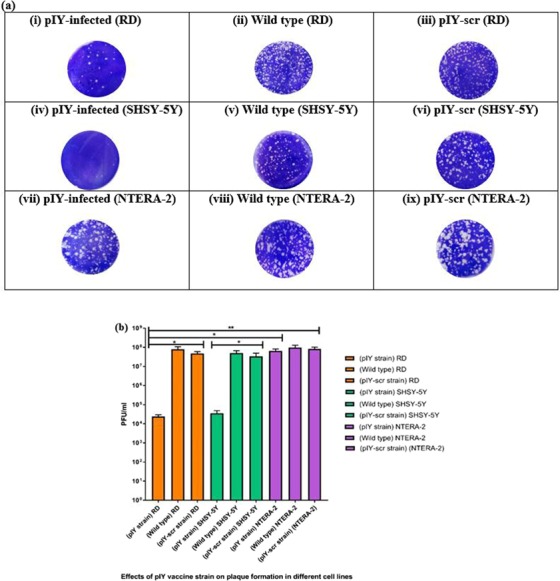
Figure 2.

Quantification of viral titer (PFU/ml) in different cell lines. (a) The plaque assays were performed in monolayer cells. PFU/ml caused by (i) pIY-infected RD cells (ii) WT EV-A71 strain 41 in RD cells (iii) pIY-scr-infected RD cells (iv) pIY-infected SHSY-5Y cells (v) WT EV-A71 strain 41 in SHSY-5Y cells (vi) pIY-scr-infected SHSY-5Y cells (vii) pIY-infected NTERA-2 cells (viii) WT EV-A71 strain 41 in NTERA-2 cells (ix) pIY-scr-infected NTERA-2 cells. (b) PFU/ml of the pIY vaccine strain, WT EV-A71 strain 41 and pIY-scr strain in three different cell lines. PFU/ml are the average of three biological replicates. Error bars indicate the standard deviation of the mean; P-values between the different groups with the one-way ANOVA. *P < 0.05, **P < 0.01.
