Figure 1.
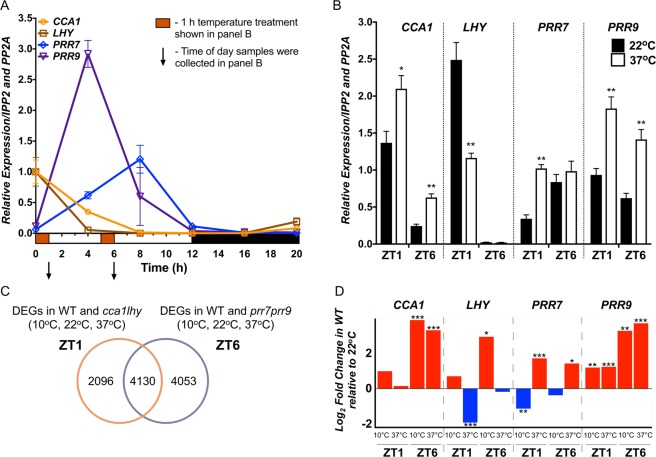
Targeted and global gene expression in response to temperature stress at specific times of the day. (A) Expression profile of CCA1, LHY, PRR7 and PRR9 in WT plants grown in 12 h Light:12 h Dark (LD) cycles for 12 d by qRT-PCR to demonstrate the time of peak expression. Hashed box indicates when plants were transferred to 10 °C or 37 °C, and down arrow when samples were collected following temperature treatment, for the results shown in panel B. X-axis, time in hours (h) and Y-axis, relative expression. (B) Changes in transcript abundance of CCA1, LHY, PRR7, and PRR9 following 1 h heat stress treatment (37 °C) as indicated in panel A. mRNA levels were normalized to IPP2 and PP2A expression (mean values ± SD, n = 3, three independent experiments). **P ≤ 0.01; *P ≤ 0.05, unpaired student t-test. X-axis, time of day samples were collected and Y-axis, relative expression. (C) Venn diagram depicting the overlapping DEGs between the cca1lhy compared to WT at all temperatures (left circle) and the prr7prr9 compared to WT at all temperature (right circle) datasets. (D) Log2 Fold Change (LFC) for CCA1, LHY, PRR7, and PRR9 in WT at 10 °C or 37 °C compared to 22 °C for ZT1 and ZT6 from our RNA-seq data. ***FDR ≤ 0.001; **FDR ≤ 0.01; *FDR ≤ 0.05.

