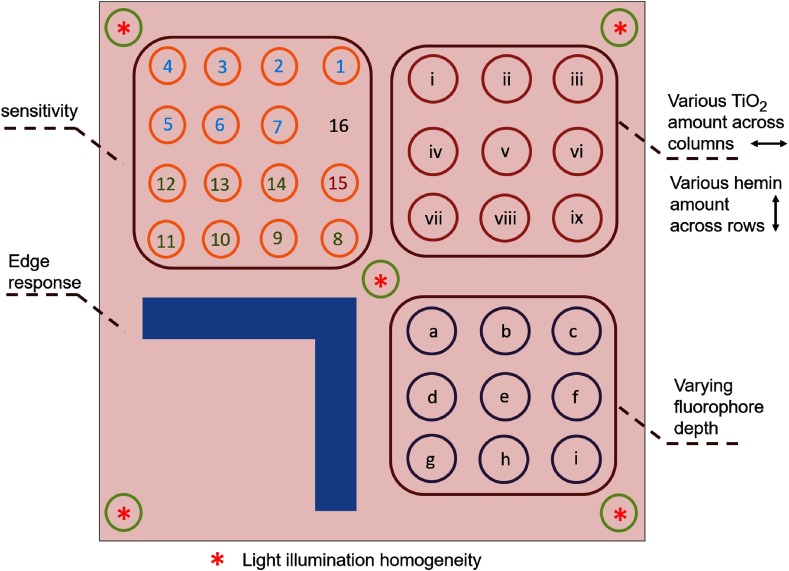
Fig. 1.
Fluorescence phantom layout. Upper left quadrant: sensitivity test region. Upper right quadrant: optical properties region with 5-nM Qdots and various amounts of across the columns and various amounts of hemin across the rows. Lower left quadrant: edge response region. Lower right quadrant: varying fluorophore depth region. The homogeneity region lies over the four corners and center of the phantom.

