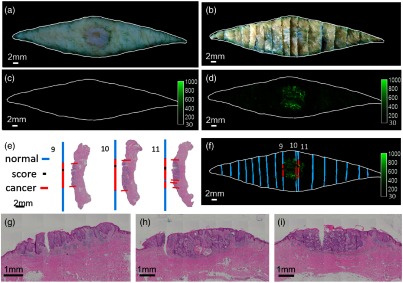
Fig. 9.
Puzzle-fit mapping of histological SCC images to the fluorescent cancer signals. (a) The fresh tissue color image. (b) The registered fixed tissue image. This sample belongs to the early protocol where tissue was scored but no black ink was added. (c) Autofluorescence image. (d) Probe fluorescence image. (e) H&E images and the “annotation lines” from trapezoidal projection method. (f) Fluorescence image fused with the “annotation lines”. The white outline of the fresh tissue border from (a) maps well to the registered fixed tissue image (b) and fluorescence images (c) and (d). Zoomed in view of center in H&E images from tissue blocks 9, 10, and 11 are shown in (g), (h), and (i), respectively. There is very good correspondence between histological cancer annotations and cancer-probe fluorescence.

