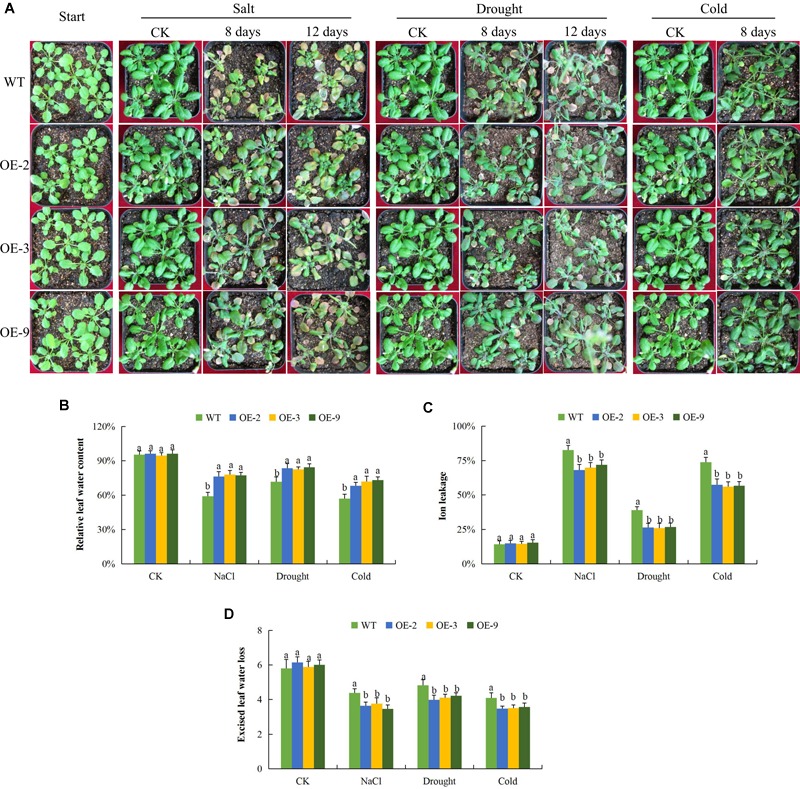
FIGURE 3.

Physiological traits measurements in Gh_D06G0281 (DTX/MATE) transgenic lines under salt, drought and cold stress conditions. (A) Transgenic lines and wild type under abiotic stress conditions (B). Quantitative determination of relative water content (RLWC). (C) Quantitative determination of cell membrane stability (CMS) as ion leakage concentration. (D) Quantitative determination of excised leaf water loss (ELWL) in leaves of wild type and both DTX/MATE over-expressing (OE) lines (OE-2, OE-3, and OE-9) after 8-day post stress exposure. In (B–D), each experiment was repeated three times. Bar indicates standard error (SE). Different letters indicate significant differences between wild type and OE lines (ANOVA; p < 0.05). CK: normal conditions.
