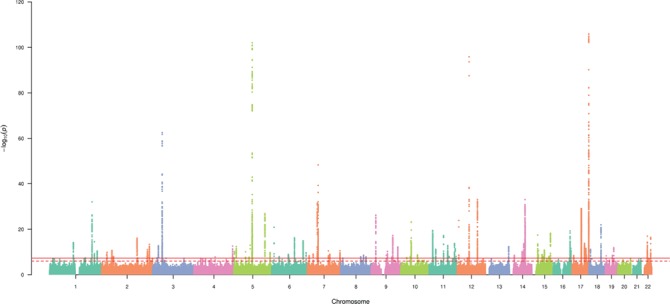
Figure 1.

Manhattan plot displaying the –log10 (P-values) for the association between macular thickness in the discovery data set. The solid and dotted horizontal lines represent genome-wide significant associations (P = 5 × 10⁻⁸) and suggestive associations (P = 1.0 × 10⁻⁶), respectively. Genetic variants are plotted by genomic position.
