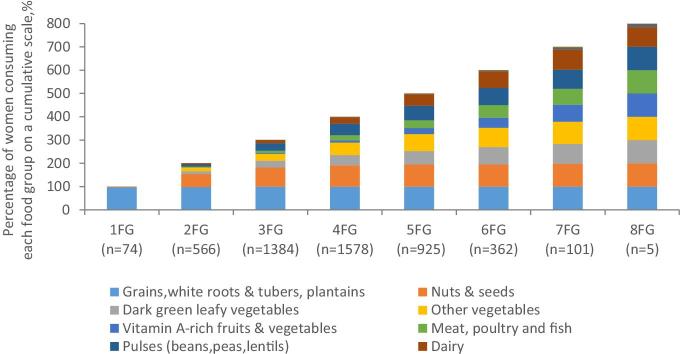
FIGURE 2.
Cumulative percentage of women consuming each food group according to the value of the Women's Dietary Diversity Score (WDDS-10; N = 4995). This way of presenting the data was chosen to show the changes in the actual percentage of women who consume each food group according to the value of WDDS-10, ranging from 1 to 8 food groups. FG, food group.

