
Figure 1.
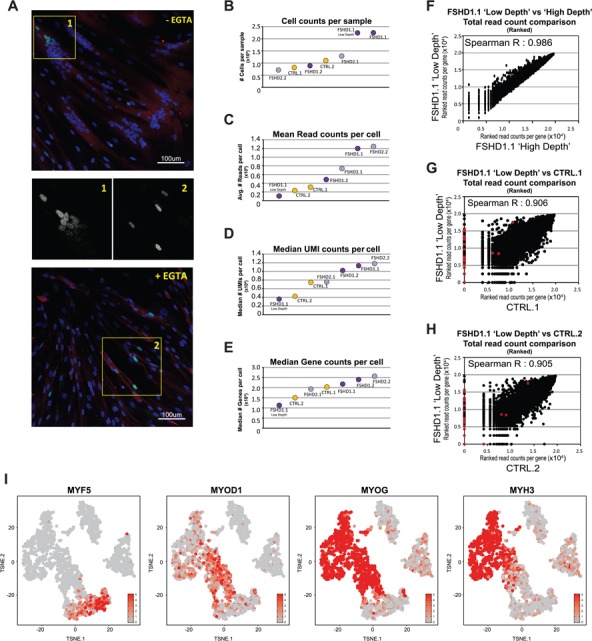
scRNA-seq quality validation per sample. (A) Representative image of IF confocal microscopy of differentiated primary myotubes (top) or differentiated late myocytes fusion inhibited by EGTA treatment (bottom). Cells were stained for DUX4 (green), nuclei were stained with Hoechst33258 (blue) and differentiated myocytes and myotubes were identified by staining for MYH1E in red. 20× magnification. From the highlighted areas, the middle panels depict DUX4 staining only. (B–E) Summary metrics per sample, with (B) the total number of cells analyzed per sample, (C) the mean total read count per cell, (D) the median UMI count per cell and (E) the median number of detected genes per cell. Both control samples are depicted in yellow, both FSHD1 samples (and the FSHD1.1 ‘Low Depth’) are depicted in dark purple and both FSHD2 samples are depicted in light purple. For detailed scRNA-seq quality validation per sample see Supplementary Material, Figure S2. (F) Scatterplot depicting the correlation between the FSHD1.1 ‘Low Depth’ and ‘High Depth’ samples. Data show the rank score of the total UMI count per gene. (G and H) Scatterplots depicting the correlation between the FSHD1.1 ‘Low Depth’ sample and (G) the CTRL.1 data set or (H) the CTRL.2 data set. Data show the rank score of the total UMI count per gene. DUX4 biomarker genes (DUX4–67 gene set) are depicted in red, showing a strong bias toward the FSHD sample versus both control samples. A detailed overview of sequence summary metrics is provided in Supplementary Material, Table S2. (I) A t-SNE projection (Cell Ranger) of sample FSHD1.1, colored based on the expression levels of four myogenic markers: MYF5, early marker; MYOD1, intermediate marker; MYOG, intermediate/late marker; MYH3, late marker. Color scales depict the normalized expression levels for each specified gene. For similar t-SNE plots of all other samples, see Supplementary Material, Figure S3.