
Figure 3.
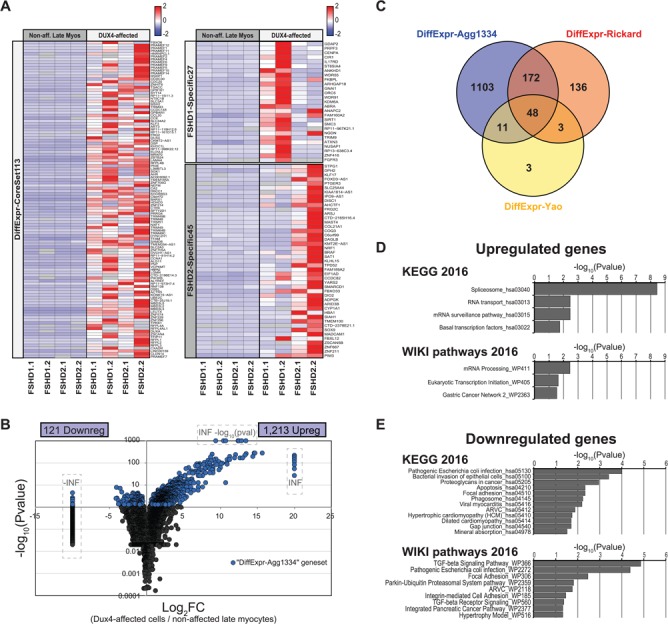
Differential expression analysis identifies a large set of known and novel DUX4-affected genes. (A) Expression heatmaps of the DiffExpr-CoreSet113 gene set (left) and the FSHD1-Specific27 and FSHD2-Specific45 gene sets (right) in the DUX4-affected cells and non-affected late myocytes. The heatmap depicts the mean expression level per gene (row-normalized read counts per gene) in the respective population per sample. See Supplementary Material, Table S4 for details on the depicted gene sets. (B) Vulcanoplot depicting the differential expression results of the Agg data set. The vulcanoplot depicts the expression level Log2FC between the DUX4-affected cells and the non-affected late myocytes versus the –log10 (adjusted P-value) for each gene. Significantly differentially expressed genes (FDR-corrected P < 0.05) are highlighted in blue. Infinite increased (INF) or decreased (−INF) expression levels and infinite –log (adjusted P-values) (i.e. P ~0) are manually set to the outer limits of the plot and are indicated by the dashed boxes. Genes with a P-value of 1 [i.e. –log (P-value) = 0)] not shown. (C) Venn diagram depicting the overlap between the 1334 differentially expressed genes in our Agg data set (DiffExpr-Agg1334 gene set) and 2 previously published DUX4 and/or FSHD-associated gene sets. Venn diagram includes only genes that could be detected as expressed in the DUX4-affected cells and/or non-affected late myocytes in the Agg data set. (D and E) Gene set enrichment analysis results of the (D) upregulated genes and (E) downregulated genes. Bar graphs depict the –log10 (adjusted P-value) of all KEGG and WikiPathway pathways significantly affected in the DUX4-affected population (adjusted P < 0.05).