
Figure 5.
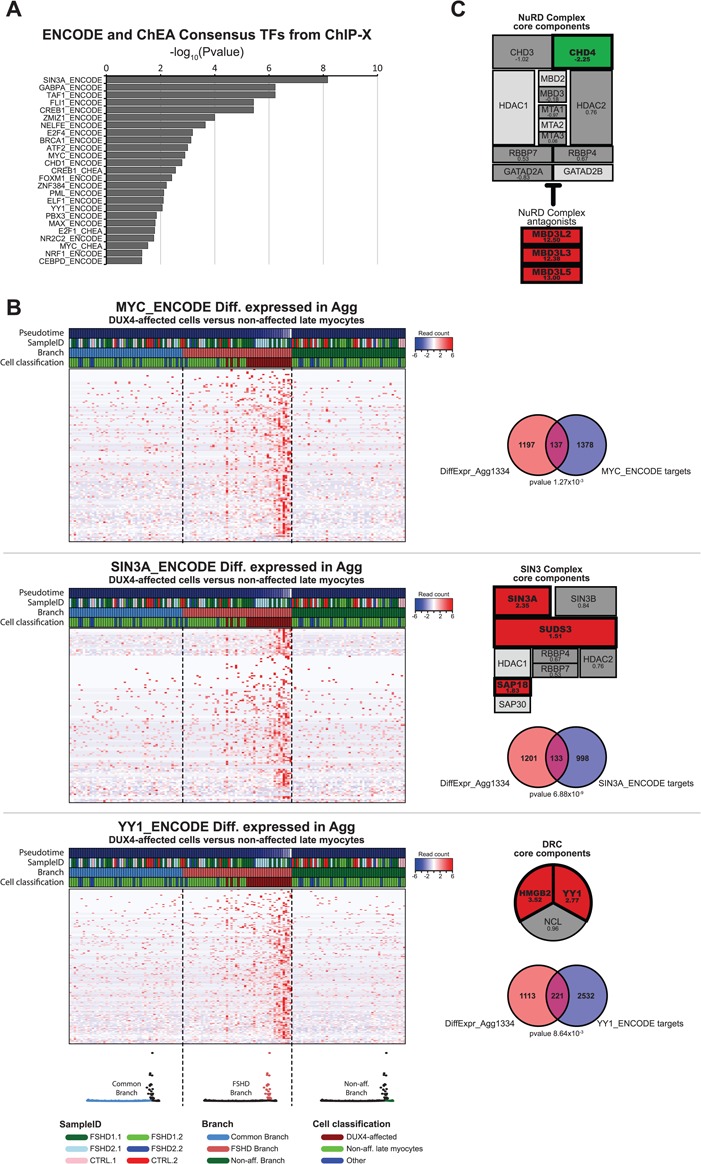
Expression dynamics of transcription regulatory complexes during FSHD pseudotime progression. (A) Gene set enrichment analysis result of the DUX4-affected genes (DiffExpr-Agg1334 gene set). Bar graph depicts the –log10 (adjusted P-value) of all significantly affected TF target gene lists from the ENCODE and ChEA consensus TFs target lists based on crosslinked ChIP-sequencing data (adjusted P < 0.05) (see Materials and Methods for details). (B) Pseudotime expression heatmaps for (top) the MYC targets, (middle) the SIN3A targets and (bottom) the YY1 targets affected in the DUX4-affected population versus the non-affected late myocytes. The cells are re-ordered by trajectory-branch, followed by pseudotime progression. The heatmap depicts the 50 cells per branch surrounding the branch point. The 50 cells per branch are separated by a dashed line and the corresponding branch is depicted in color in the trajectory model below the heatmaps. The Venn diagrams depict the overlap between the known TF targets and the DUX4-affected gene set (DiffExpr-Agg1334), with the P-value indicating the FDR-corrected P-value (Benjamini Hochberg) for the gene set enrichment analysis in Enrichr. The schematic overviews of the SIN3 complex and DRC depict the log2FC in the DUX4-affected versus non-affected late myocytes. Significantly affected genes (FDR-corrected P < 0.05) are highlighted in bold and color. Red indicates a significant increased expression; green indicates a significant decreased expression. Light gray components indicate genes excluded from analysis due to limited sequencing depth (see Materials and Methods for details.) (C) Schematic overview of the NuRD complex depicting log2FC as in (B).