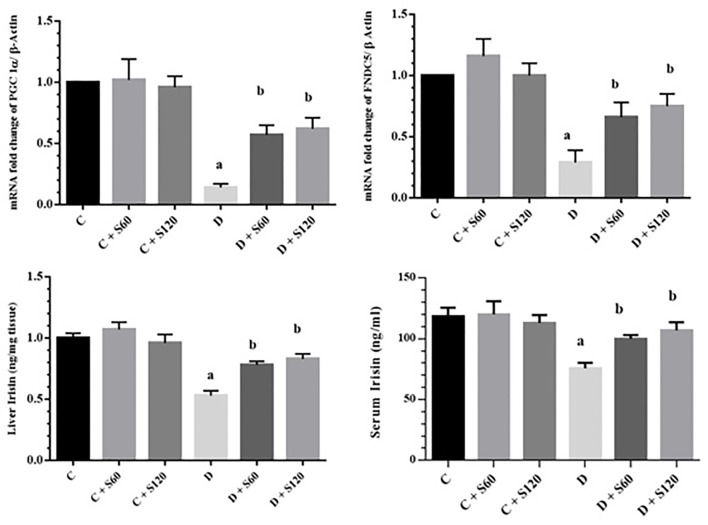
Figure2.
Effect of silymarin on PGC-1α, FNDC5, and irisin. The results are expressed as means±SDs. A) PGC-1α mRNA levels in the liver; B) FNDC5 mRNA levels in the liver; C) liver irisin, and D) serum irisin concentration. C: Control; S: Silymarin; D: Diabetic; FNDC5: Fibronectin type III domain-containing protein 5; aSignificant compared to the healthy control group; bSignificant compared to the diabetic control group; Significant difference between the diabetic and control groups in the all the parameters (P<0.001); Significant difference between the treated diabetic rats (60 and 120 mg/kg) and the diabetic groups in PGC-1α (P=0.04 and P=0.02), FNDC5 (P=0.03 and P=0.01), liver irisin (P=0.02 and P=0.01), and serum irisin (P<0.001)

