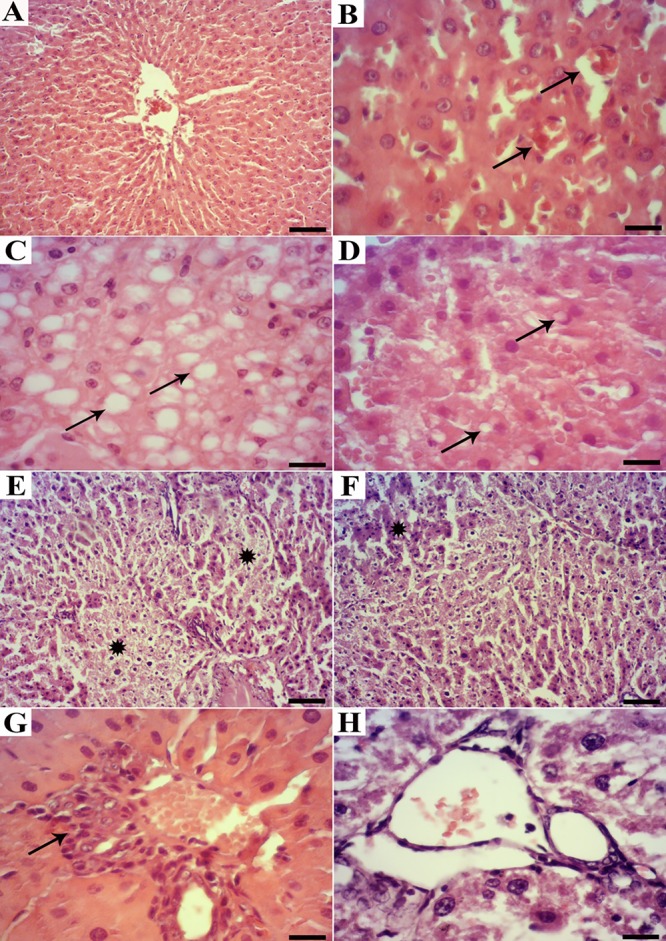
Figure3.

Histopathological observation in the liver tissues of the experimental rats. A) Normal rat: A normal lobular pattern is seen with a centrilobular vein and radiating irregular anastomosing plates of the hepatocytes with intervening sinusoids (H&E, scale bar=100 µm), B) Diabetic rat: Congestion and dilation of the sinusoids (arrows) (scale bar=25 µm), C) Diabetic rat: Disorganization of the hepatic cords and the presence of degenerated hepatocytes with macrovesicular steatosis (stars) (scale bar=25 µm), D) Treated diabetic rat: Cytoplasmic vacuoles in the cytoplasm (scale bar=25 µm), E) Diabetic rat: Focal necrosis (stars) (scale bar=100 µm), F) Treated diabetic rat: Disorganization of the hepatic cords and mild hepatocyte degeneration (star) (scale bar=100 µm), G) Diabetic rat: Mild-to-moderate infiltration of the mononuclear cells around the portal area (arrow) (scale bar=25 µm), H) Treated diabetic rat: Normal portal area without mononuclear cell infiltration (scale bar=25 µm)
