
Fig. 1.
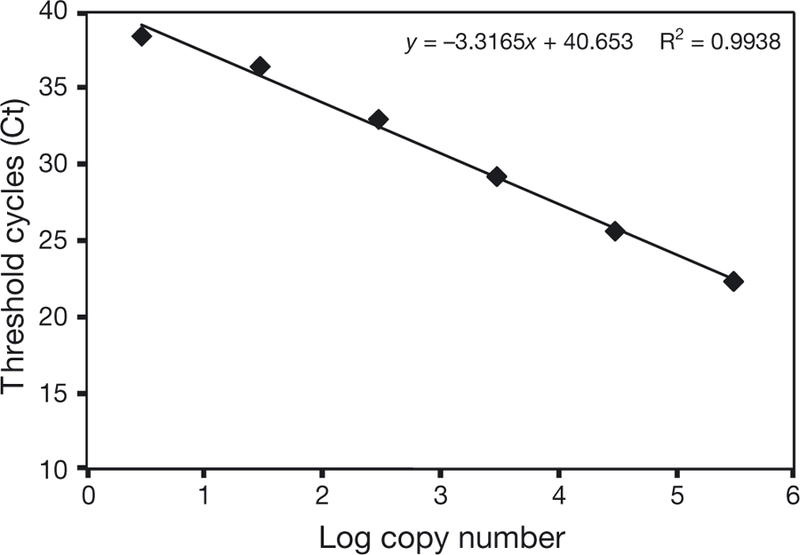
Standard curve developed using a 10-fold serial dilution of DNA from Leptospira interrogans serovar Pomona, ranging from 3 to 3 × 10⁵ genome copies per PCR volume. The regression line is for data that are in the linear range. The graph shows the mean values from 3 replicates for each dilution