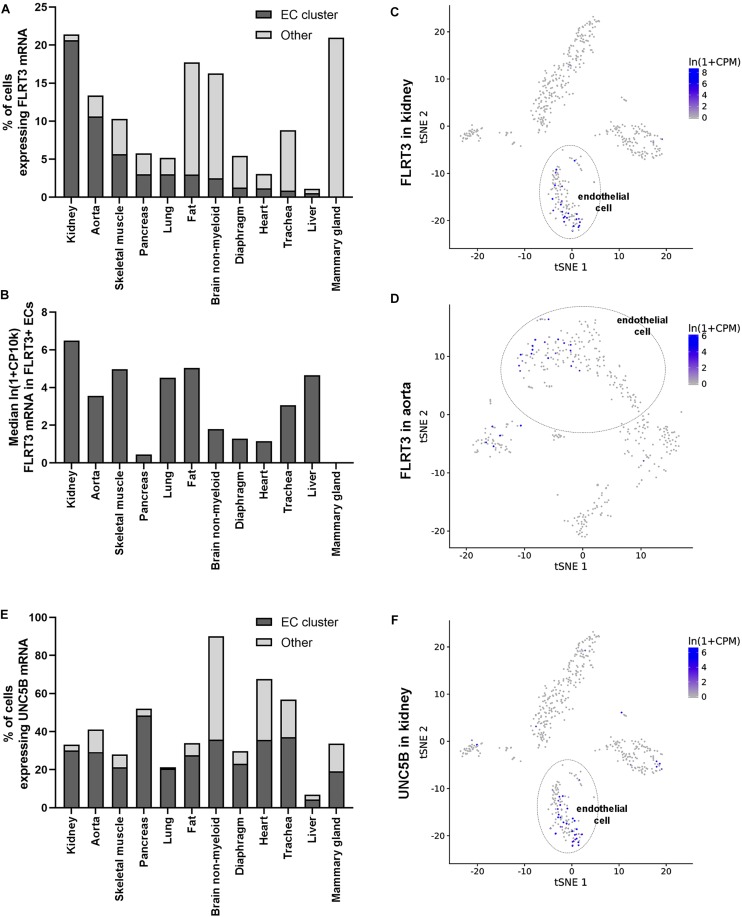
FIGURE 7.
Expression of FLRT3 in ECs in vivo. (A,B) Single-cell sequencing data shows that FLRT3 mRNA is expressed in EC cluster of most of the mouse tissues included in the database (Tabula Muris Consortium et al., 2018). In addition, cells positive for FLRT3 mRNA were detected in several other cell clusters in all the tissues. (A) Percentage of ECs (dark gray) and other cells (light gray) positive for FLRT3 mRNA in each tissue. (B) Relative expression level of FLRT3 mRNA in FLRT3-positive ECs. (C,D) t-SNE plots showing the expression of FLRT3 mRNA based on PCA clustering of kidney (C) and aorta (D). (E) Percentage of ECs positive for UNC5B mRNA in mouse tissues. (F) t-SNE plots showing the relative distribution of UNC5B mRNA in the kidney.

