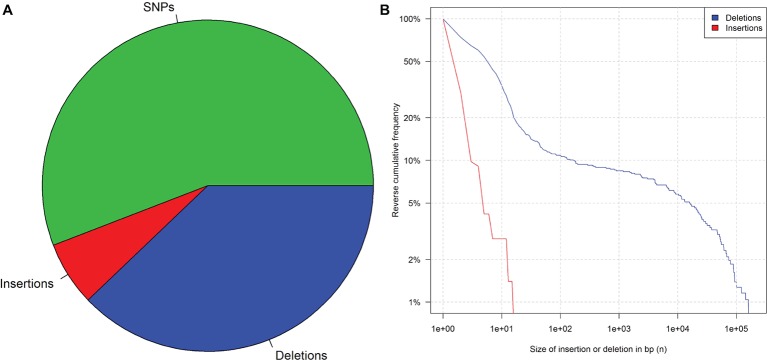
Figure 1.
Mutation frequency in 41 rice plants after irradiation and three generations of propagation. (A) Pie chart of SNPs, insertions, and deletions. (B) Reverse cumulative frequency distribution of indels that are at least n base pairs long. Data from Li et al. (2016), supplementary.

