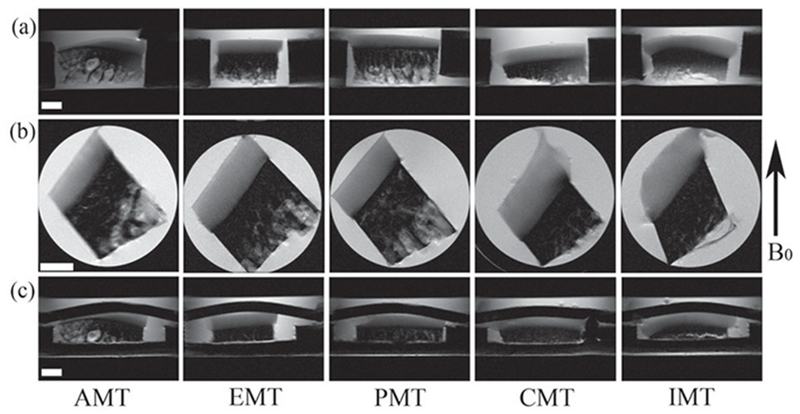
Figure 2.

(a) The coronal intensity images without loading, which are used to define the slice location of the subsequent sagittal images in (b). (c) The coronal intensity images under loading. The white bar indicates 1 mm. The display intensities of all images in the figure are the same.
