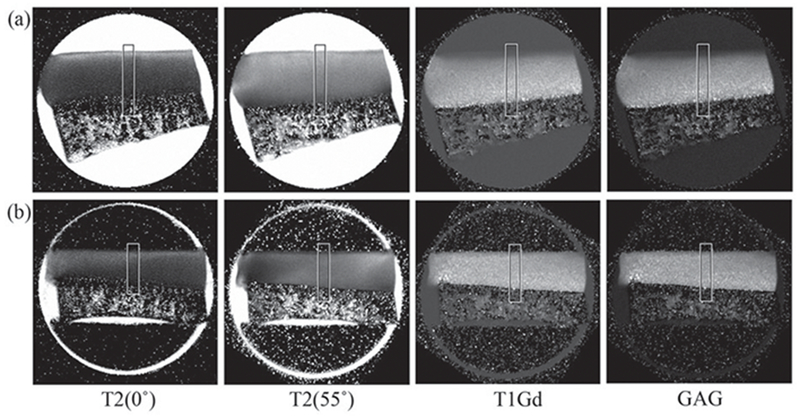
Figure 3.

Quantitative MRI images of a specimen without loading (a) and while loaded (b). The angle was defined as the angle between the articular surface of cartilage and the direction of the magnetic field (B0). The T2(55°) and T1Gd images were acquired at 55° and rotated in the image analysis.
