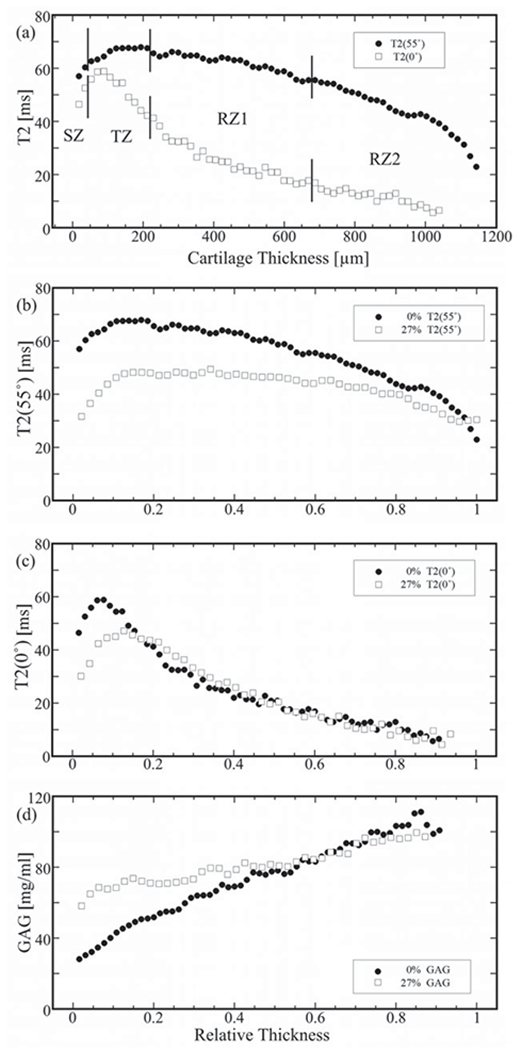
Figure 4.

A representative set of 1D μMRI profiles from a single specimen. (a) T2 profiles with zonal divisions at 0° (solid dots) and 55° (open squares). (b) T2 profiles at 55°. (c) T2 profiles at 0°. (d) GAG profiles. [In b and c, the solid dots are for the unloaded (UL) profiles and the open squares are for the loaded (L) profiles at the strain of 27.7% and the all profiles were normalized to compare the profiles of the UL and L, setting 0 at the surface and 1 at the cartilage-bone interface.].
