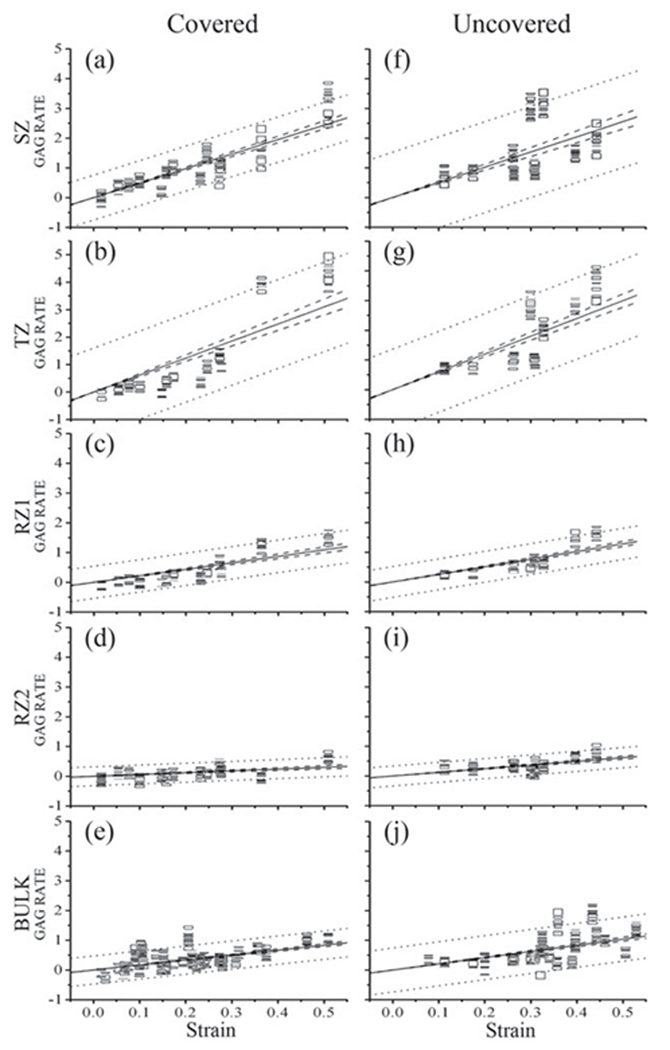
Figure 5.

A representative set of the load-induced changes of GAG ((L-UL)/UL) at different zones in the meniscus covered (left) and uncovered areas (right). Since SZ and TZ had wider prediction intervals and higher slopes than RZs, it can be predicted that the GAG concentration at the surface tissue could change more and be more sensitive to loading than the deep tissue. The dashed line showed the 95% confidence intervals and the dotted line showed the 95% prediction intervals.
