Figure 6.

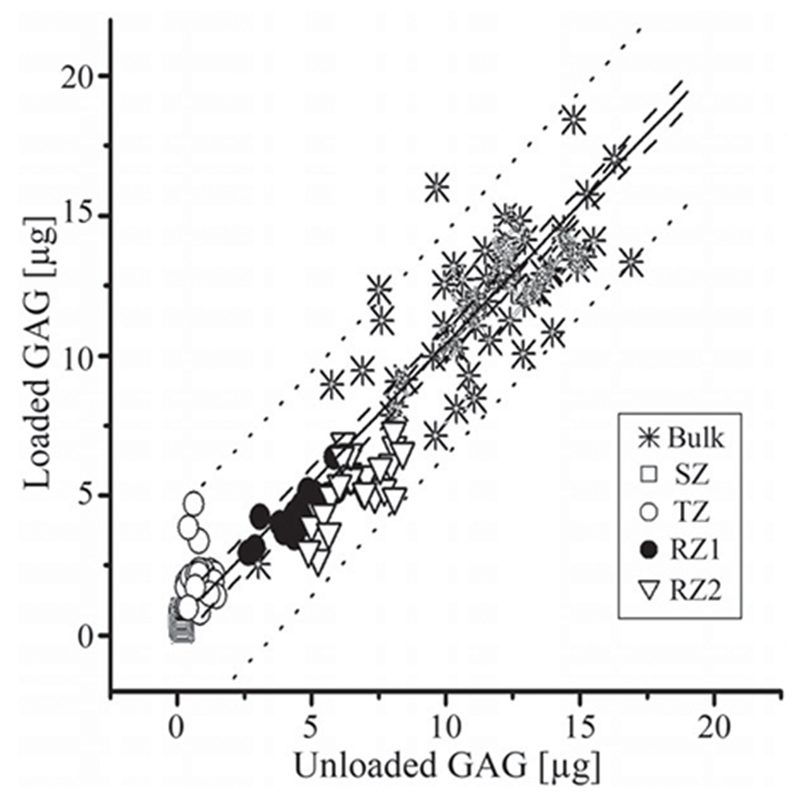
The bulk and zonal contents of GAG (in mg unit) before and after the loading. The solid line showed the slope of 1, the dashed line showed the 95% confident intervals and the dotted line showed the 95% prediction intervals.

The bulk and zonal contents of GAG (in mg unit) before and after the loading. The solid line showed the slope of 1, the dashed line showed the 95% confident intervals and the dotted line showed the 95% prediction intervals.