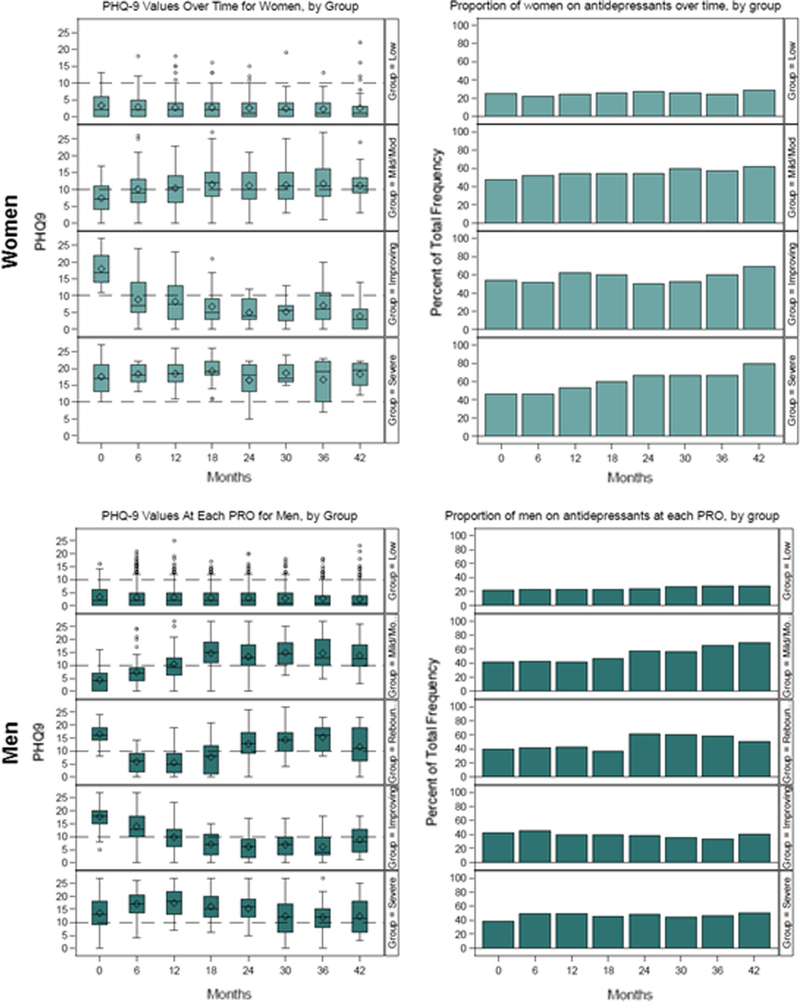
Fig. 2.
Distribution of Patient Health Questionne-9 (PHQ-9) depressive symptoms scores and proportion receiving antidepressant treatment prescription over time, stratified by gender and assigned trajectory group (based on each participant’s highest predicted posterior group-membership probability). Box and whisker plots of depressive symptoms scores indicate median and interquartile range values in the box, minimum and maximum values in the whiskers, and outliers in the circles

