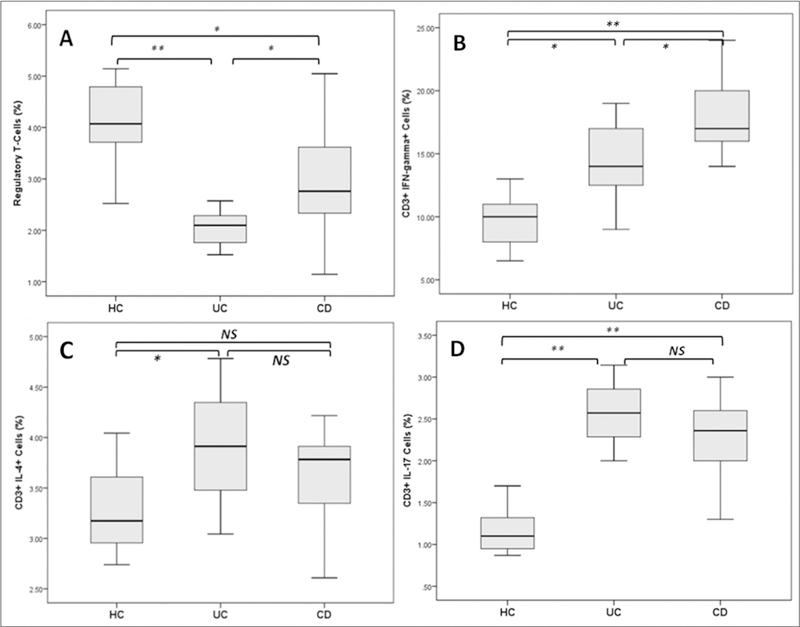
Figure 3.
Quantification of Treg, TH1, TH2, and Th17 cells in the peripheral blood from patients with IBD. Th17 and lymphocytes analyzed by flow cytometry.
Boxplots show the percentage of (A) Treg (CD4+CD25+Foxp3+), (B) Th17 (CD4+ IL-17A+), (C) Th17/Treg ratio, (D) Th1 (CD4+ IFN-γ+), and (E) Th2 (CD4+ IL-4+) cells in the studied groups. HC - healthy controls, UC - ulcerative colitis patients, CD - Crohn’s Disease patients, NS - not significant, asterisks denote statistical significance, * p < 0.05, ** p < 0.01.

