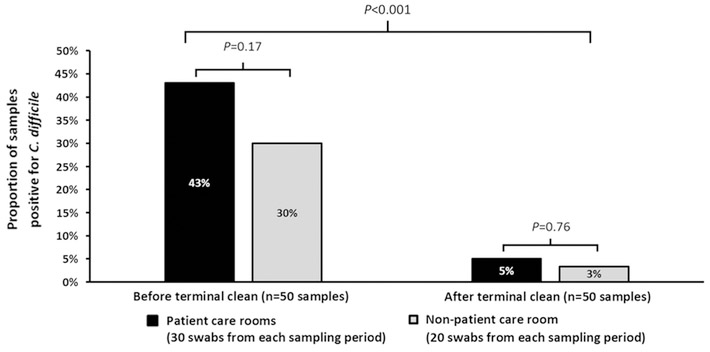
Fig. 1.
Proportion of positive environmental samples before and after facility-wide terminal clean with 10% bleach solution. Plotted on the x-axis is the time point before and after terminal clean and the y-axis shows the percentage of samples that were positive for C. difficile. There was a significant difference in percentage of specimens positive for C. difficile between patient care rooms (black bars) and non-patient care areas at both time points. Terminal cleaning significantly reduced the C. difficile burden overall.

