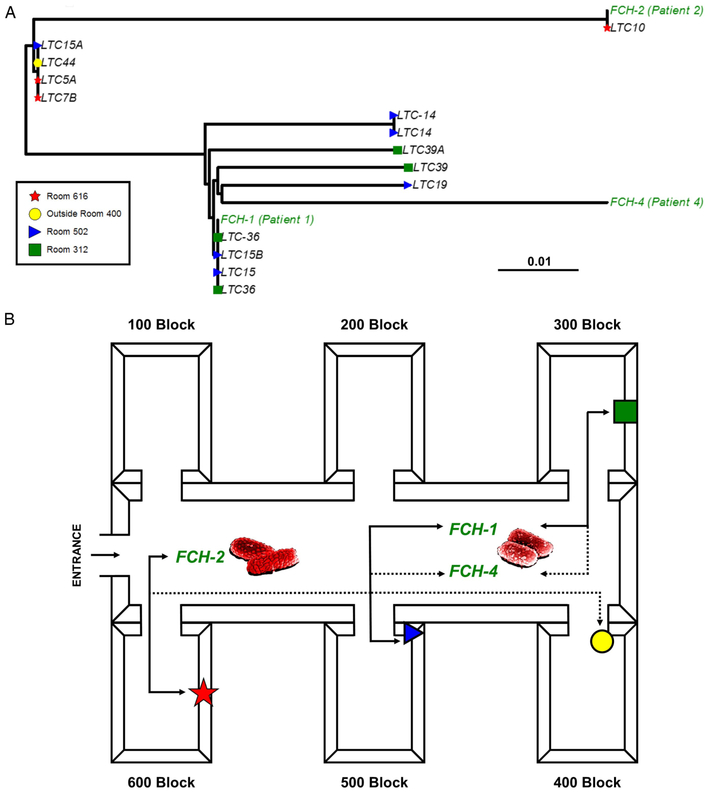
Fig. 2.
Maximum likelihood phylogeny and CDI transmission map. (A) The phylogenetic tree was made from 44 SNP sites and is midpoint rooted. Patient isolates are colored in green font and environmental samples in other colors based on location. The bar at the bottom of Fig. 2a (0.01) refers to degree of relatedness of isolates. (B) Using the epidemiological data with the phylogeny, a suspected transmission map was made of the long-term care facility. A solid line indicates an isolate shared a direct contact and was genetically identical to another isolate, whereas the dotted line indicates a suspected connection to another isolate. Red spore indicates a patient isolate. For example, clinical isolate FCH-2 was genetically identical to an environmental isolate from the 600 block of the LTC that was highly similar but not identical to an environmental isolate from the 400 block.

