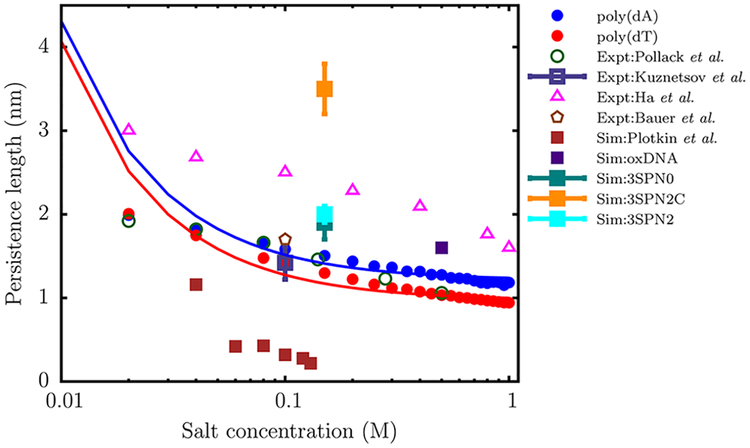
Figure 10.
Variation of the persistence length (lp) with salt concentration for the dT40 (red) and dA40 (blue) sequences computed from the simulation. The solid curves are fits of the simulation data to the OSF theory (eq 20). The lp values reported by Pollack and co-workers,75 using a combination of SAXS and smFRET experiments, are shown as green open circles. The triangles denote the experimental data of Ha and co-workers.72 The open square with an error bar represents the experimental data of Kuznetsov et al.,73 for a dT hairpin at 0.1 M. The brown polygon denotes the lp value reported by Bauer and co-workers74 for a dT100 sequence at 0.1 M using FCS experiments. The filled squares denote the persistence lengths estimated by using coarse-grained models with a resolution similar to ours: data in brown are from Plotkin and co-workers,22 oxDNA (purple),23 3SPN0 (teal),39 3SPN2 (cyan),24 and 3SPN2C(orange).40 We do not include the data for 3SPN191 as it lies outside the experimental range.

