Figure 4.
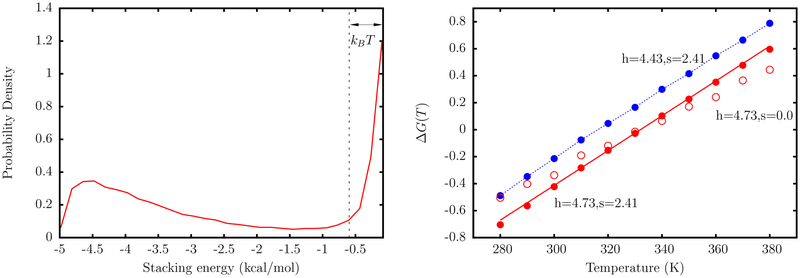
Left: A representative distribution of stacking energies, US from simulations of a dimer represented by the TIS model. All configurations with US < −kBT are considered as stacked. Right: The free energy of stacking for dimer as a function of temperature. The red solid line corresponds to the experimental line, with free energies given by the parameters in Table 2. The red filled circles represent simulation results, with h and s chosen such that the experimental temperature dependence is reproduced. These values correspond to the case where ΔG0 = 0. The red open circles correspond to the case where Tm is reproduced, but the entropy is underestimated. The blue circles are simulation data for h and s where the free energy is shifted by a constant factor.

