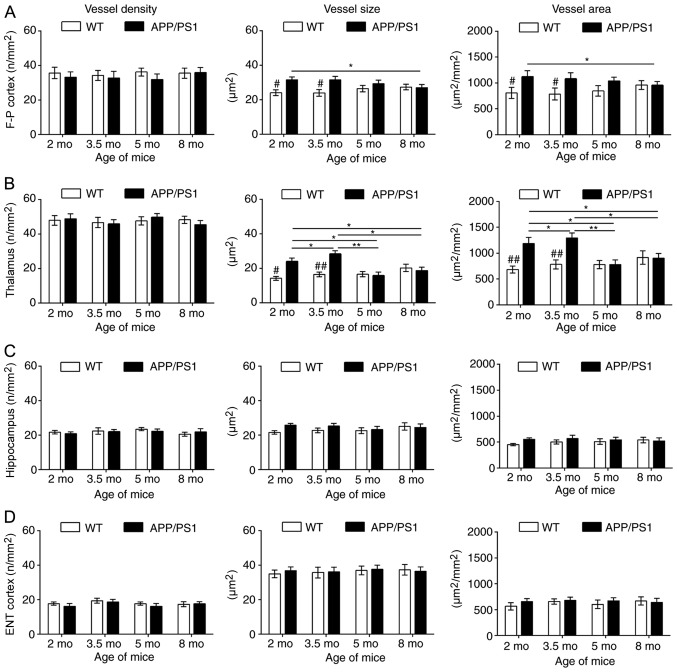
Figure 4.
Quantitative analysis of cluster of differentiation 31-staining. Age-associated changes in the vessel density, size and area (per mm2) in the (A) F-P cortex, (B) thalamus (C) hippocampus and (D) ENT cortex for WT and APP/PS1 mice at age 2, 3.5, 5 and 8 mo. #P<0.05 and ##P<0.01 vs. age-matched mice; *P<0.05 and **P<0.01 vs. APP/PS1 mice of other age groups. WT, wild-type; mo, months old; ENT, entorhinal; F-P, frontoparietal.

