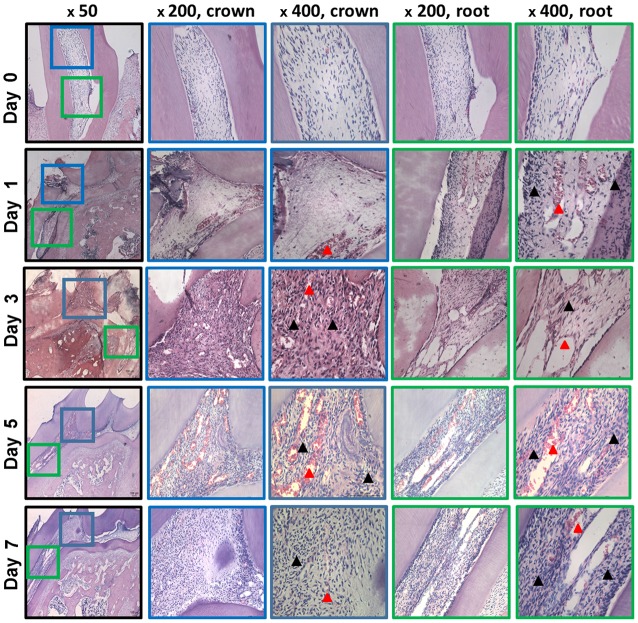
Figure 1.
Histological analysis of the increase in inflammation between day 1 and 7. Hematoxylin and eosin was used for counterstaining. The blue frame displays the crown pulp, while the green frame displays the pulp. Black arrowheads indicate the odontoblast layer that displayed an irregular distribution, including vacuolar degeneration and a lack of odontoblasts. Dilated vessels and blood clot are indicated by the red arrowheads.

