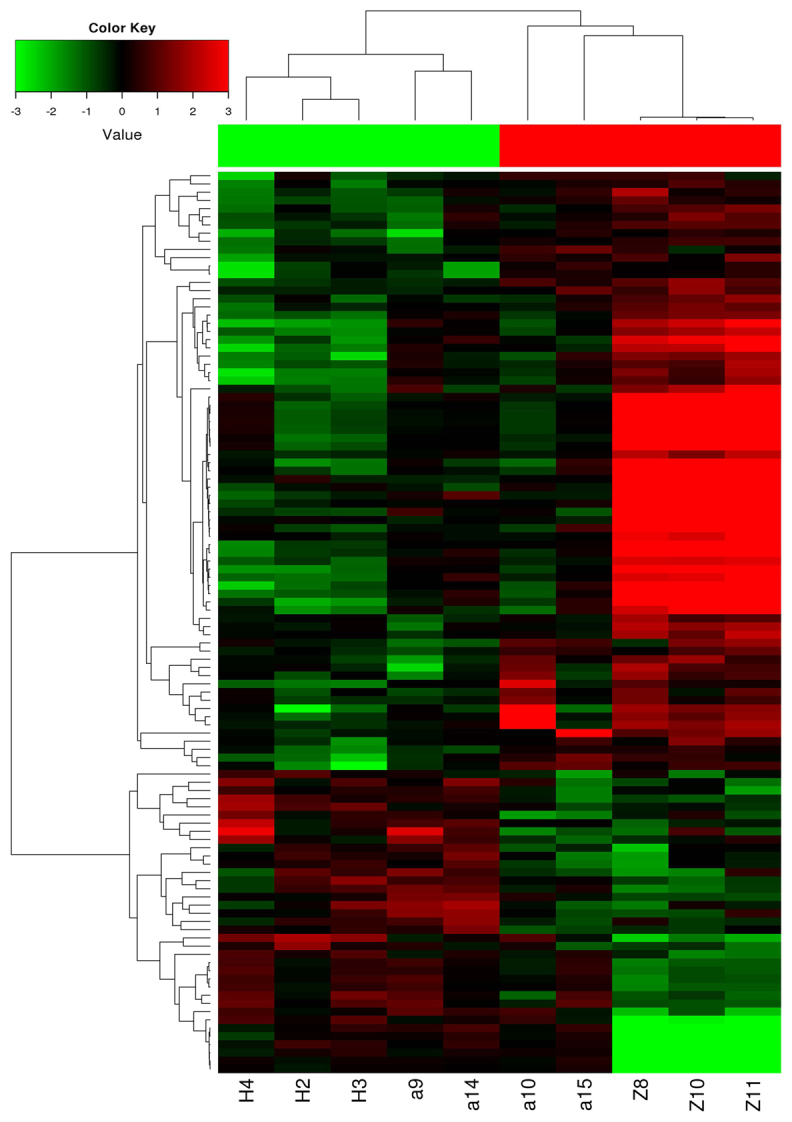
Figure 1.

Map of cluster analysis for CHD. The heat map is constructed by hierarchical cluster analysis. Red and green indicate up- and downregulation during circRNA, respectively. The heat map includes 110 gene expression levels which were significantly altered by CHD. The genes in 10 clusters, denoted as group 1 (a9, a14, H2, H3, H4) and group 2 (a10, a15, Z8, Z10, Z11), were 73 upregulated and 37 downregulated. CHD, coronary heart disease; circRNA, circular RNA.
