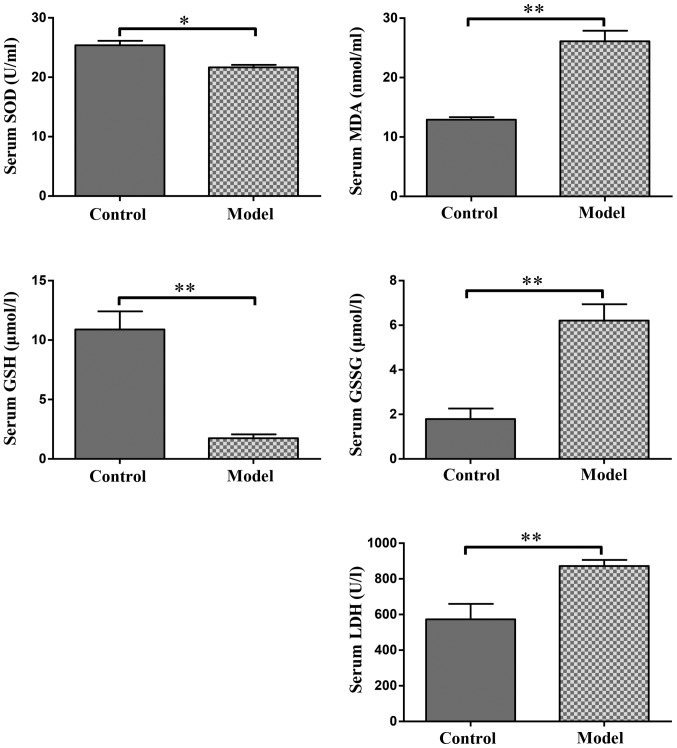
Figure 2.
Effect of hypoxia on serum SOD, MDA, GSH, GSSG and LDH levels. The values are presented as the mean ± standard deviation. *P<0.05 and **P<0.01 with comparisons shown by lines. MDA, malondialdehyde; LDH, lactate dehydrogenase; SOD, superoxide dismutase; GSH, glutathione; GSSG, oxidized glutathione.

