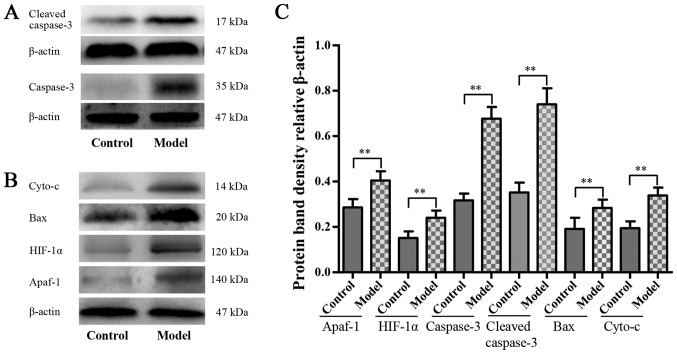
Figure 5.
Hypoxia-activated mitochondrial apoptosis pathway. Western blot analysis for (A) caspase-3 and cleaved caspase-3, (B) Apaf-1, HIF-1α, Bax and cyto-c protein level in each group, n=6. (C) Quantified western blot analysis results. The values are presented as mean ± standard deviation. **P<0.01 with comparisons shown by lines. Apaf-1, apoptotic protease activating factor-1; HIF-1α, hypoxia inducible factor-1α; Bax, Bcl-2-associated X protein; cyto-c, cytochrome c.

