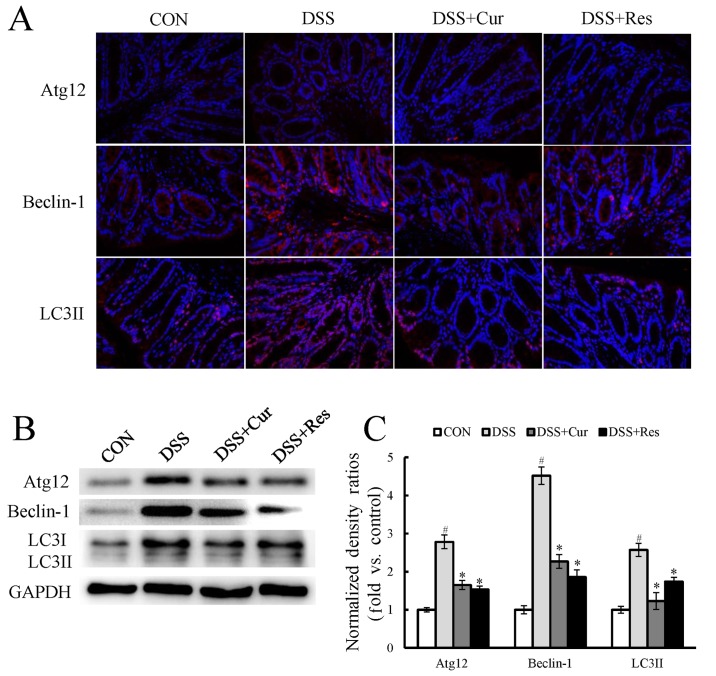
Figure 4.
Effect of curcumin or resveratrol treatment on the expression of autophagy-associated genes in colon tissues. (A) Immunofluorescence staining for Atg12, Beclin-1 and LC3B (red) and nucleus (green). (B) Representative western blots presenting the relative protein expression of autophagy-associated proteins in the colon tissue. (C) Densitometry analysis of the western blots. Data are presented as the mean ± standard error of six mice per group. #P<0.05 vs. the CON group; *P<0.05 vs. the DSS alone group. CON, control; DSS, dextran sulfate sodium; Cur, curcumin; Res, resveratrol; Atg12, autophagy-related 12; LC3, microtubule-associated protein light chain 3.

