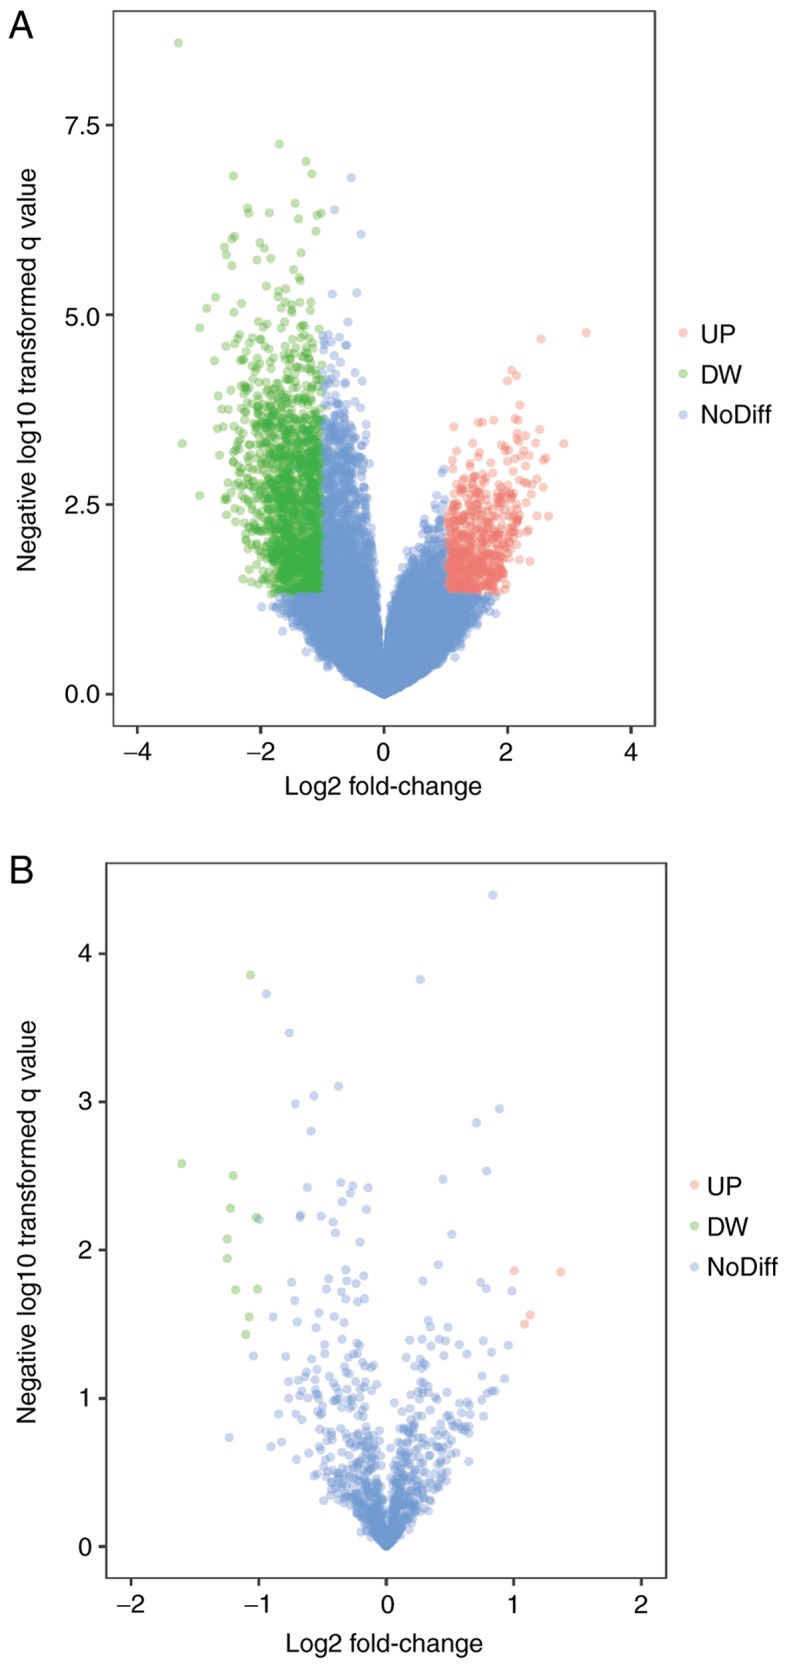
Figure 1.

Differentially expressed genes between two sets of samples. (A) GSE39058 data, (B) GSE39040 data. The red points represent upregulated genes screened on the basis of |fold change|<2.0 and P<0.05. The green points represent downregulated genes screened on the basis of |fold change|<2.0 and P<0.05. The blue points represent genes with no significant difference. UP, upregulated; DW, downregulated; NoDiff, no significant difference.
