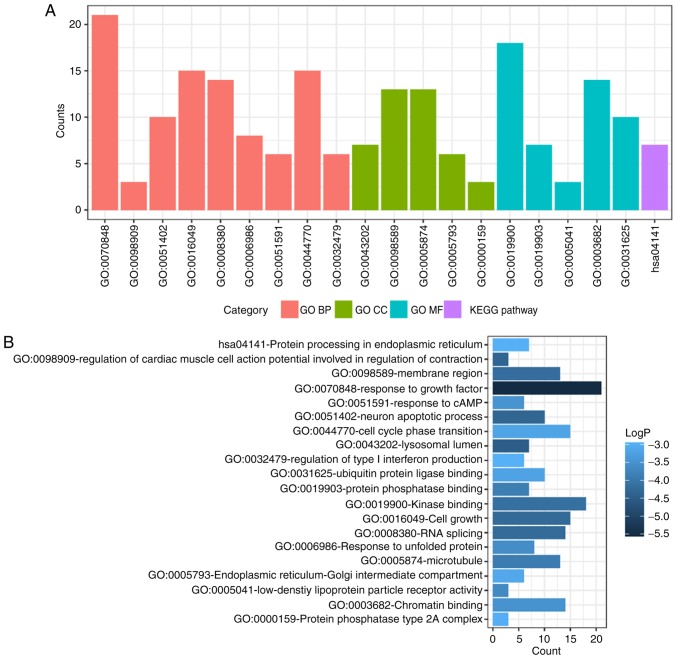
Figure 4.
GO and KEGG pathway enrichment analysis of upregulated DEMs. (A) GO and KEGG pathway enrichment analysis divided DEMs into four functional groups. (B) Statistical significance of GO and KEGG pathway enrichment of DEMs in different functional groups. DEMs, differentially-expressed mRNAs; GO, Gene Ontology; BP, biological process; CC, cellular component; MF, molecular function; KEGG, Kyoto Encyclopedia of Genes and Genomes; cAMP, cyclic adenosine monophosphate.

