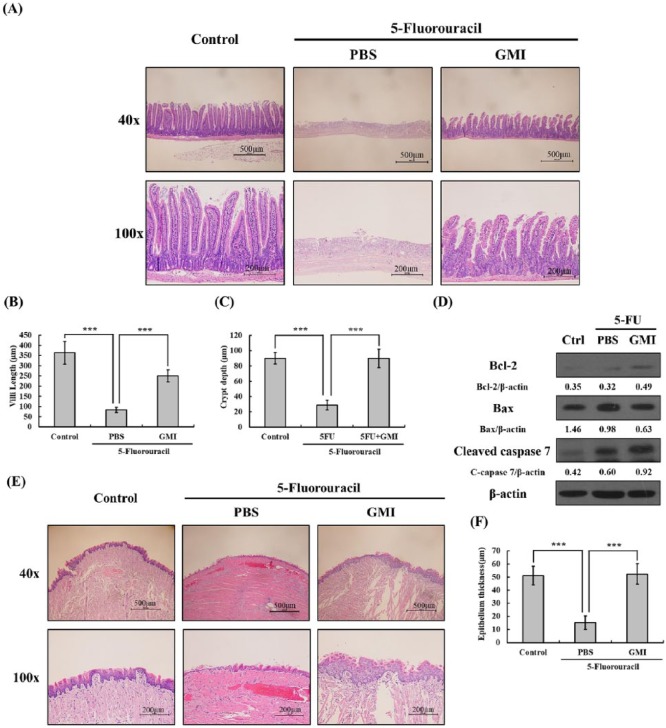
Figure 3.
Histological changes in the intestinal villi and tongue were determined using hematoxylin and eosin (H&E) staining. (A) The upper 3 pictures showed the longitudinal section of jejunum on 40× field, while the lower 3 pictures showed the structure on 100× field. (B and C) The villi length and crypt depth of intestinal villi were randomly measured in different parts of jejunum on the same group of samples. ***P < 0.001. (D) Cell lysates of intestinal samples were extracted, and the level of Bcl-2, Bax, and cleaved caspase 7 were analyzed by Western blot. Beta-actin was used as an internal control. (E) The upper 3 pictures showed the cross section of tongue on 40× field, while the lower 3 pictures showed the structure on 100× field. (F) The epithelial thickness of the tip tongue was measured. ***P < .001. Data presented are means ± SD.

