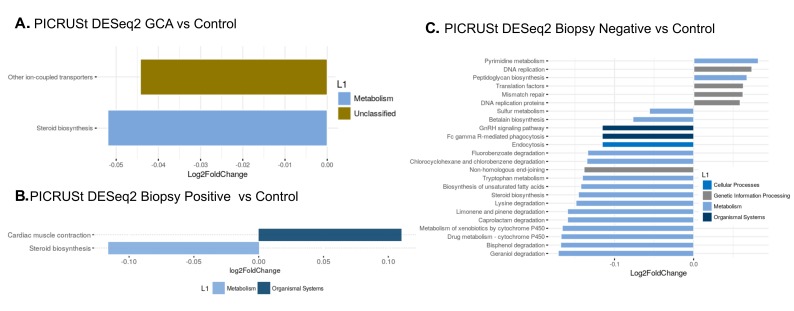
Figure 4.
Predicted functional pathways differentially represented in GCA TA compared to control (non-GCA) TA. Representation of PICRUSt DESeq2 analysis yielding relatively under-represented functional pathways in (A) GCA TA compared to control TA, (B) biopsy-positive GCA TA compared to control TA and (C) biopsy-negative GCA TA versus control TA.

