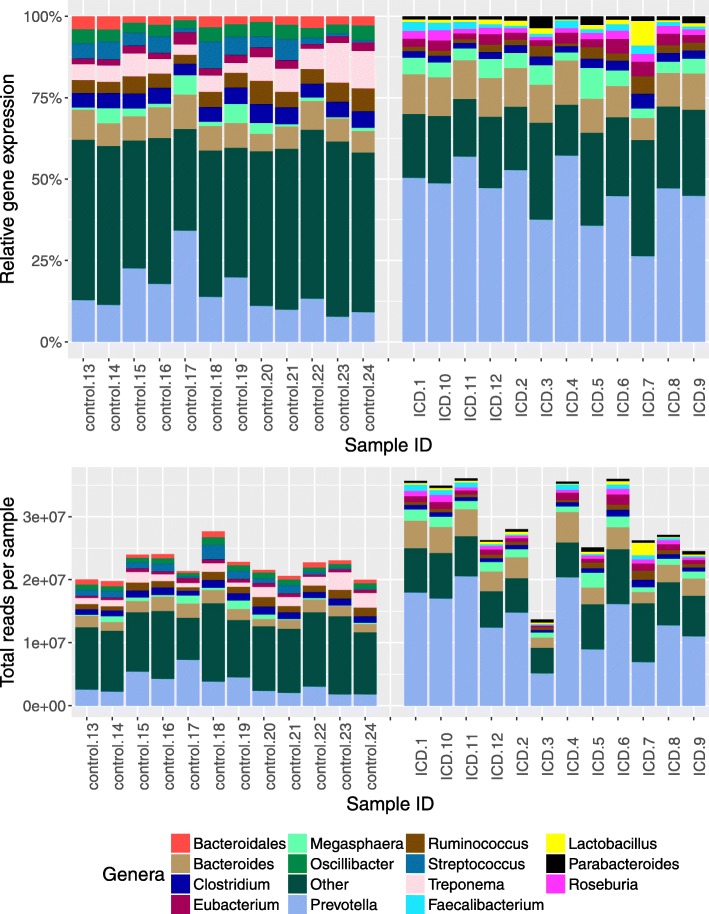
Fig. 3.
Composition of genera with the highest number of transcripts in stool samples from control and ICD-afflicted macaques. Stacked bar graphs are relative (top) and absolute (bottom) transcript counts per genus in each sample. Only the top ten genera from either control or ICD samples are depicted; all remaining genera are summarized as the “Other” category (dark green)

