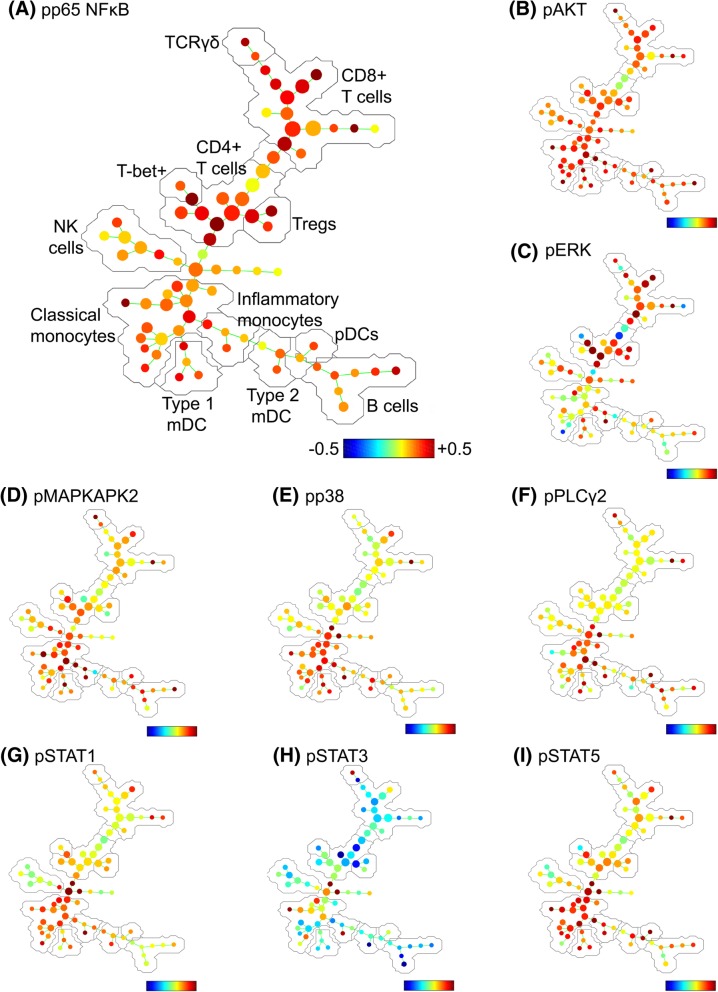
Fig. 4.
Spanning tree progression of density-normalised events (SPADE) trees showing evidence of pro-inflammatory activation in distinct lymphocyte and myeloid cell populations in the blood of CRPS participants relative to healthy controls. The SPADE algorithm was run on a downsampled population of single leukocytes from all CRPS and control participants. SPADE trees were generated showing the fold-change between CRPS and control groups in the expression of phosphorylated (activated), a p65 NFκB, b AKT, c ERK, d MAPKAPK2, e p38, f PLCγ2, g STAT1, h STAT3 and i STAT5. The major cell populations labelled in (a) are representative of all SPADE trees. Note: colour scales vary for each marker

