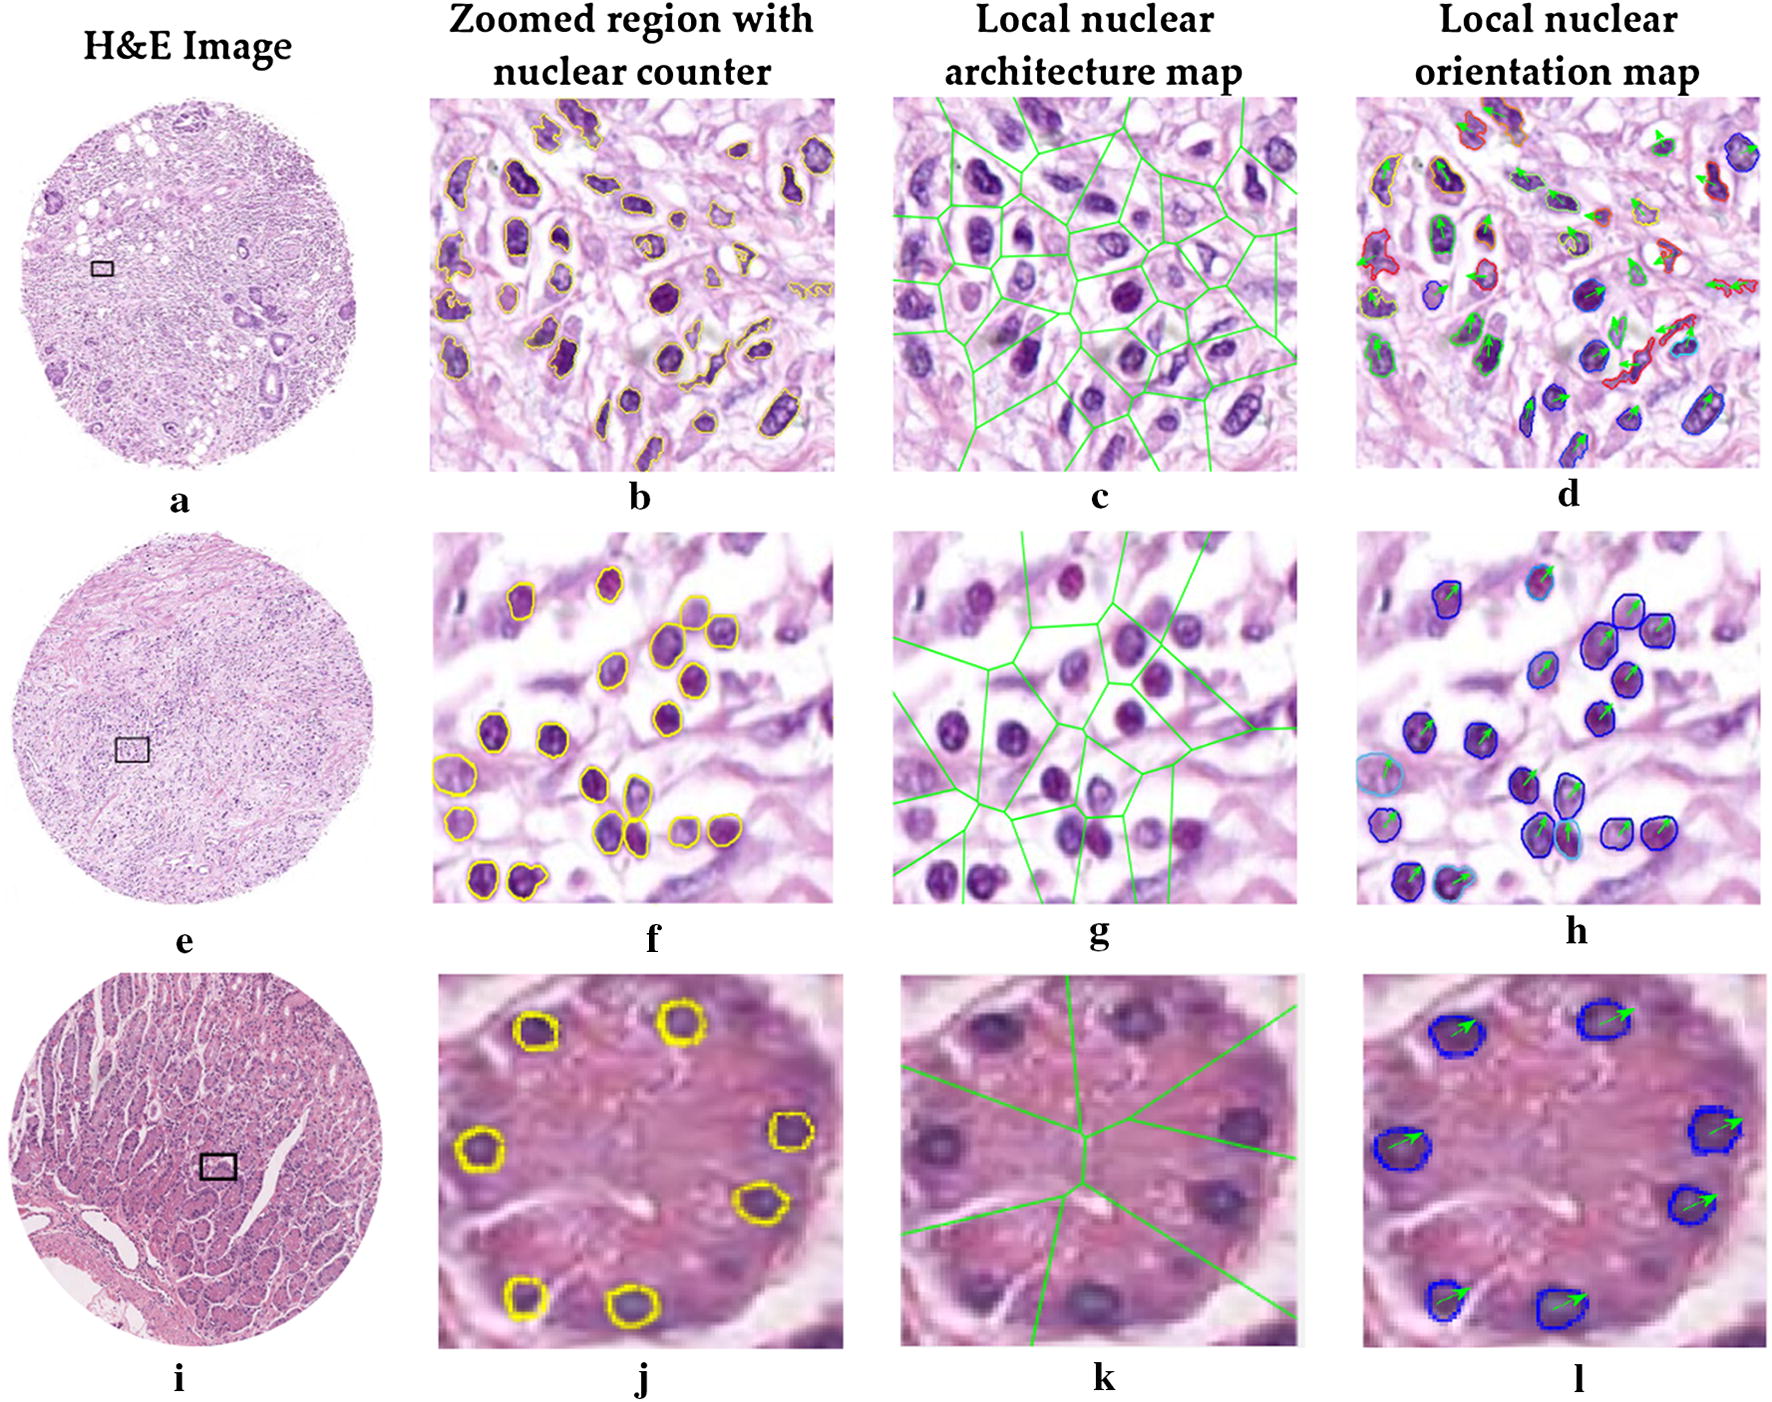
Fig. 3.

Analysis of digital pathological H&E image of NGA. H&E image from a patient with recurrence (a), without recurrence (e) and negative controls (i). The zoomed region with nuclear counters (b, f, j), nuclear shape, local nuclear architecture maps (c, g, k) and corresponding nuclear orientation maps (d, h, l) were extracted from b, f and j. In d, h and l, the arrows and different colors nuclear contours represent different nuclear orientations. The nuclear architecture feature map appeared to sparser and the nuclear shape and orientation tended to more uniform in local cluster regions (shown in f–h) for non-recurrence patient, compared with that of recurrence patient (shown in b–d)
