Fig. 5.
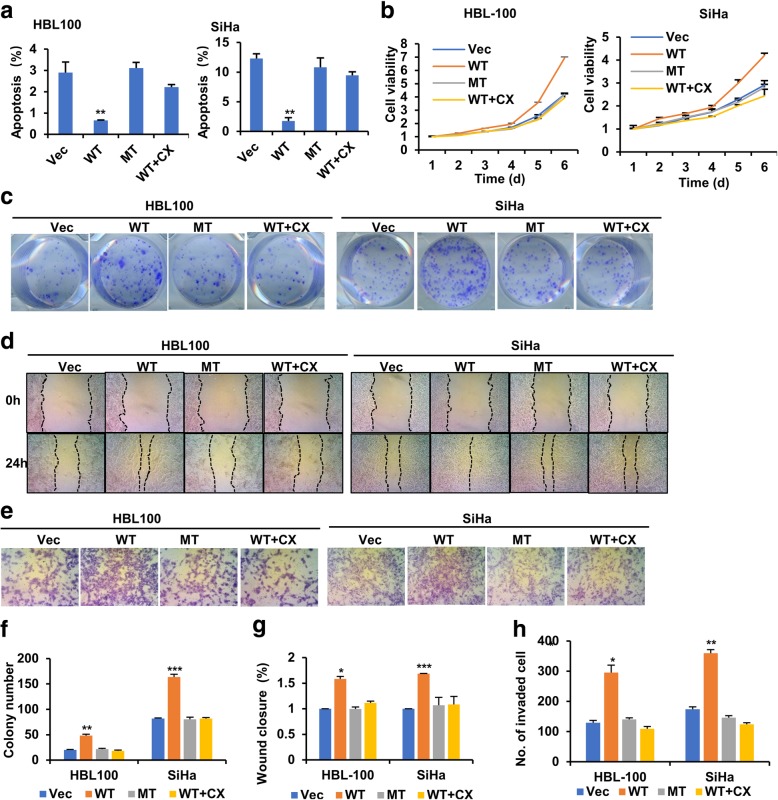
Inhibition of CCDC106 phosphorylation suppresses tumorigenesis and metastasis. a The apoptosis rates were investigated by annexin V-FITC/PI double staining and FCM analysis (FCM graphs are shown in Additional file 1: Figure S5). b Cell viability was determined by an MTT assay. c Representative images of cell colonies. d Representative images of a wound area at the indicated timepoints. e Representative images of invaded cells in the Transwell invasion assay. f, g and h Statistical analysis of colony numbers (f), the percentage of wound closure at 24 h after scratching (g) and the invaded cells in the Transwell invasion assay (h). All the values are presented as the means ± S.D. for at least three independent in vitro experiments. Differences between control and experimental groups were analyzed by Student’s t-test; *p-value ≤0.05, **p-value ≤0.01, and ***p-value ≤0.001. Vec, WT, and MT represent cells stably expressing empty vector, CCDC106 and S130/147A mutant, respectively; CX: CX-4945

