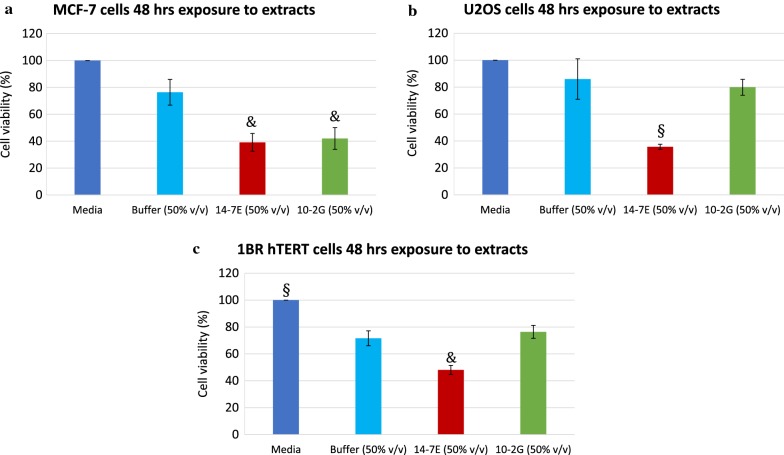
Fig. 3.
Cell viability percentage of cell lines after exposure to whole cell lysates. a MCF-7 cells, b U2OS cells and c 1BR hTERT cells, after 48 h exposure to 50% v/v extracts of: 14-7E (red) and 10-2G (green). Also presented are the media controls (dark blue) and 50% v/v buffer controls (light blue). The presented data for each condition is the mean of at least three independent experiments. P values are denoted as follows: & ≤ 0.05, # ≤ 0.01 and § ≤ 0.001

