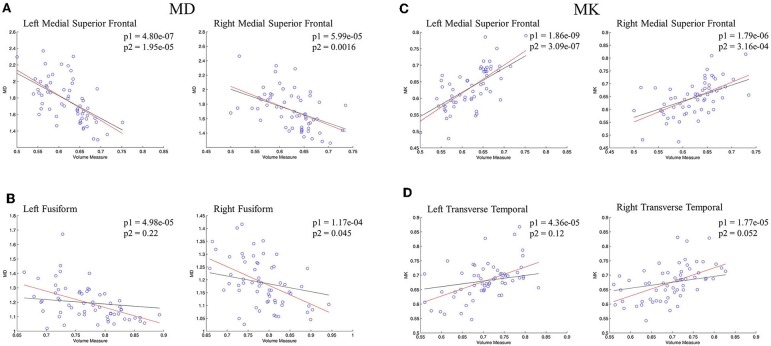
Figure 5.
The regression results of GM volume and DKI indexes in representative regions. (A,B) showed the scatterplots of GM volume and MD; (C,D) showed the scatterplots of GM volume and MK. The red lines represent a linear regression between GM volume and microstructure indexes, and the black lines represents a linear regression between GM volume and microstructure indexes after controlling for age. The significant levels of red lines and black lines were p1 and p2, respectively.

