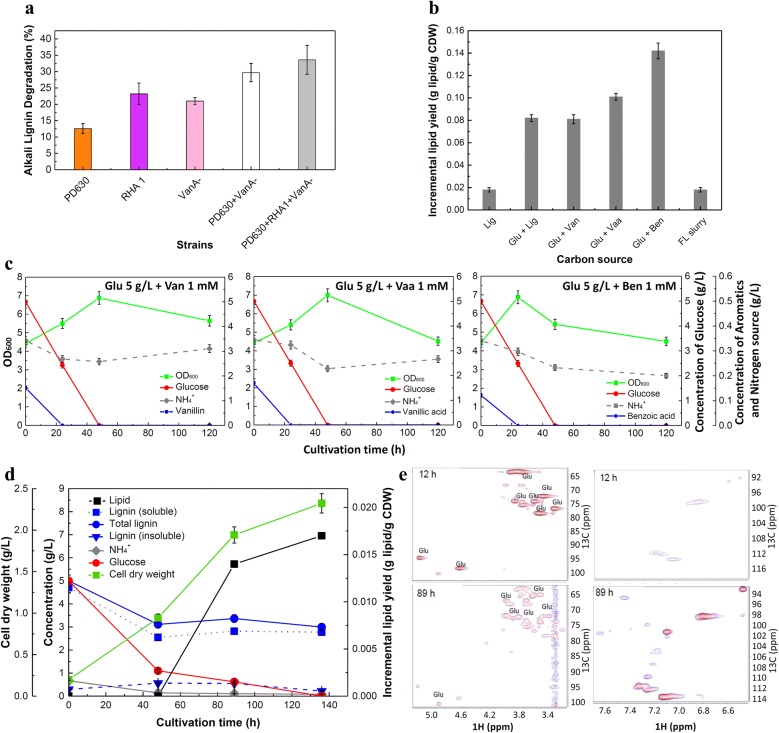
Fig. 2.
Biological conversion of carbohydrate and lignin (or lignin derivatives) into lipids by Rhodococci. a The comparison of lignin degradation by single- or co-culture of R. opacus PD630 (simplified as PD630 as presented), R. jostii RHA1 (simplified as RHA1), and/or R. jostii RHA1 VanA− (simplified as VanA−). b Effects of carbon sources on the lipid content. The abbreviation of the names of carbon sources is used in the figure. The full names from left to right are: alkali lignin 5 g/L (control experiment); glucose 5 g/L + alkali lignin 5 g/L; glucose 5 g/L + vanillin 1 mM; glucose 5 g/L + vanillic acid 1 mM); FL slurry (glucose 5 g/L + pretreated lignin 0.593 g/L + alkali lignin 4.41 g/L). c Effects of carbon sources on the cell growth, glucose conversion and (NH4)2SO4 consumption. The left, glucose 5 g/L + vanillin 1 mM; the middle, glucose 5 g/L + vanillic acid 1 mM; the right, glucose 5 g/L + benzoic acid 1 mM. d Time courses for cell growth, carbohydrate conversion, lignin consumption, (NH4)2SO4 utilization and lipid production using carbohydrate and lignin from the enzymatic hydrolysis of flowthrough hydrolysates (FL slurry) as the carbon source. e 1H-13C HSQC-NMR analysis of fermentation supernatant from the co-culture of R. opacus PD630, R. jostii RHA1, and R. jostii RHA1 VanA− on carbon source of FL slurry. The left two graphs show the chemical shift region of carbohydrates while the graphs on the right show the chemical shift region of aromatics

