Fig. 1.

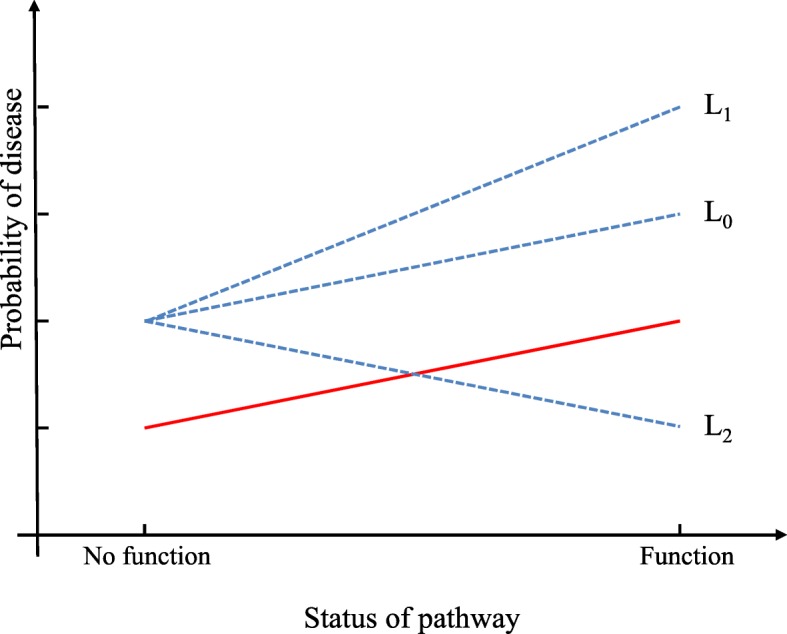
The illustration of GPI in binary phenotypes. The red line represents the effect of the significant pathway. The three black dot lines represent three situations: positive interaction (L1), no interaction (L0) and negative interaction (L2)

The illustration of GPI in binary phenotypes. The red line represents the effect of the significant pathway. The three black dot lines represent three situations: positive interaction (L1), no interaction (L0) and negative interaction (L2)