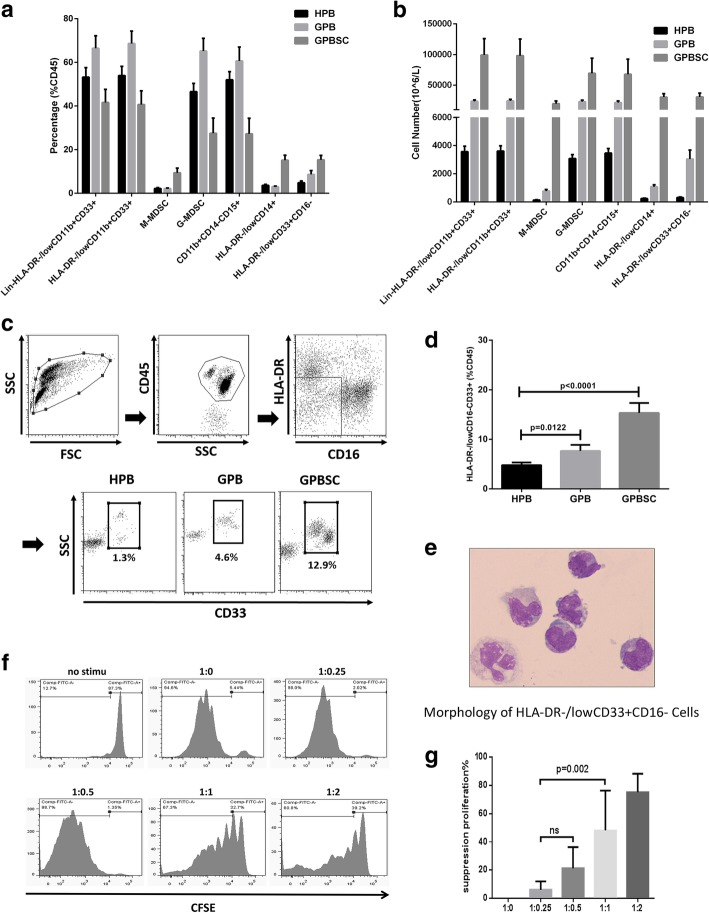
Fig. 1.
HLA-DR−/lowCD33+CD16− myeloid cells expanded in PB and PBSC after G-CSF administration and exerted a strong immunosuppressive effect on T cell proliferation. a, b The frequency and cell number of different kind of MDSCs and HLA-DR−/lowCD33+CD16− population in ten donors (H-PB, G-PB, G-PBSC) were analyzed by flow cytometry. c Gate strategies of HLA-DR−/lowCD33+CD16−: FSC, forward scatter; SSC, side scatter. d The proportion of HLA-DR−/lowCD33+CD16− in the CD45+ fraction from the ten healthy donor’s HPB, GPB, and GPBSC (medians of the different groups were 4.6%, 6.5%, and 15.5% of total CD45+cells, Mann-Whitney t test). e May-Grünwald-Giemsa cytospin preparations show morphological features of HLA-DR−/lowCD33+CD16−. f T cell proliferation was examined using CFSE dilution. HLA-DR−/lowCD33+CD16− and CD3+ T cells from the same donor G-PBSC were co-cultured at different ratios for 4 days with anti-CD3/CD28 beads. T cell proliferation was evaluated using CFSE labeling. Unstimulating T cells were negative control. The picture shows the representative results. g The percentage of T cells in suppression was shown in different groups. Data was compared using unpaired t test (ns, not significant)

