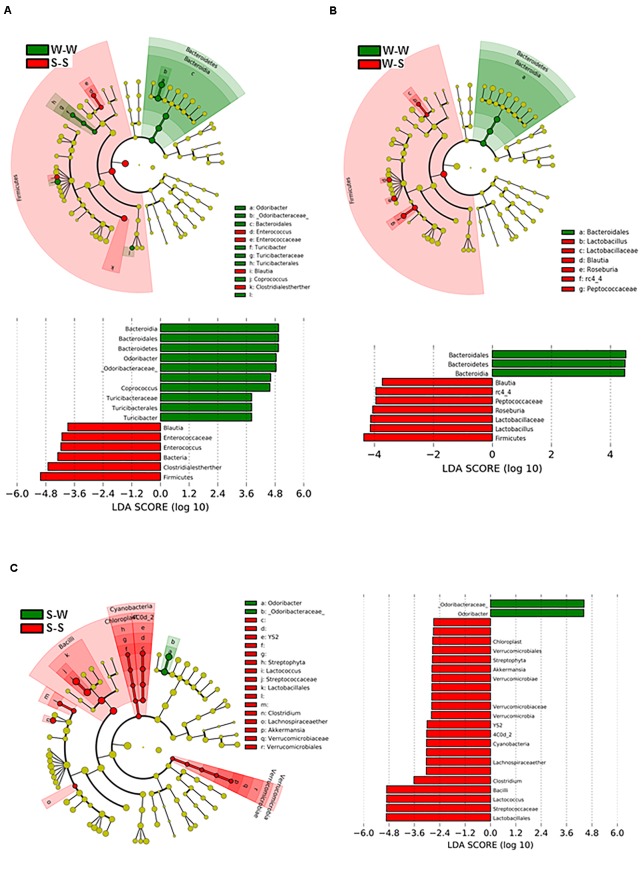
FIGURE 6.
Effects of fecal microbiota transplantation (FMT) on changes of the gut microbiome. Comparisons of microbiome changes in WKY with stool transplant from WKY versus SHR with stool transplant from SHR (A) WKY-WKY versus WKY-SHR (B) and SHR-SHR versus SHR- WKY (C). Cladograms (top panes) show the significantly enriched taxa, the taxa are identified in the key to the right of each pane. The larger the circles the greater the difference in abundance between the groups. The lower panels show the results of linear discriminant analysis effect size at p < 0.05 and LDA score of > 2.5 and detail the taxa most enriched by WKY, SHR or SHR-WKY. n = 6 animals per treatment group in each comparison.

