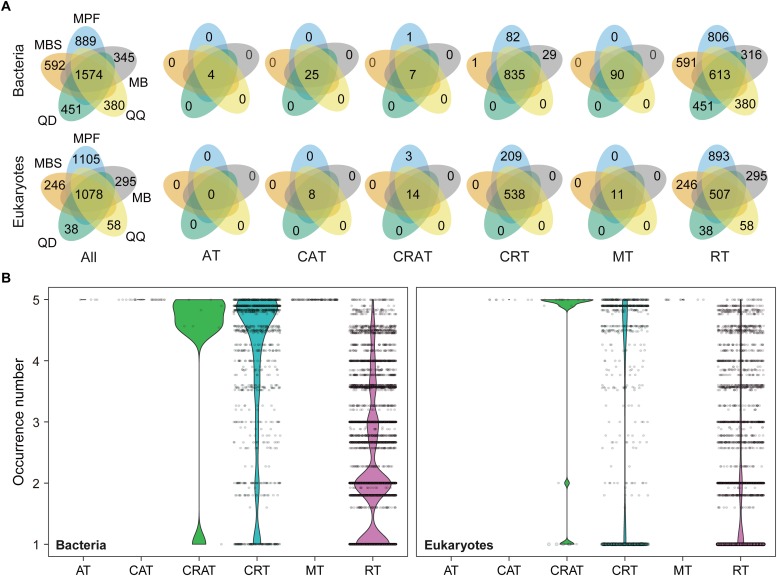
FIGURE 3.
The effect of DNA extraction kits on the OTUs occurrence. (A) Venn diagram showing the number of OTUs that shared and unique by different DNA extraction kits. (B) The occurrence (that is, the number of DNA extraction kits where an OTU was found) based on niche breadth analysis for all the bacterial and eukaryotic OTUs, respectively. AT, always abundant taxa; CAT, conditionally abundant taxa; CRAT, conditionally rare and abundant taxa; CRT, conditionally rare taxa; MT, moderate taxa; RT, always rare taxa.

