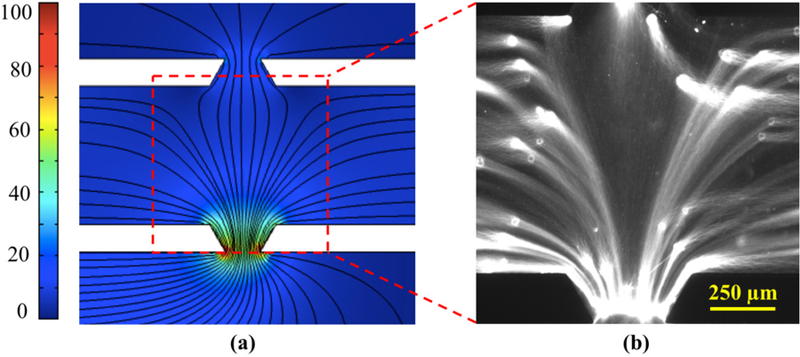
Fig. 3.

(a) Computed electric field lines in the gel corresponding to the single-anode configuration of Fig. 2b at 10 V potential. Color bar represents electric field magnitude in V/cm. (b) Fluorescent image of YOYO-stained whole genomic DNA, extracted from MCF-7 cells in the device, following the field lines during electrophoresis.
