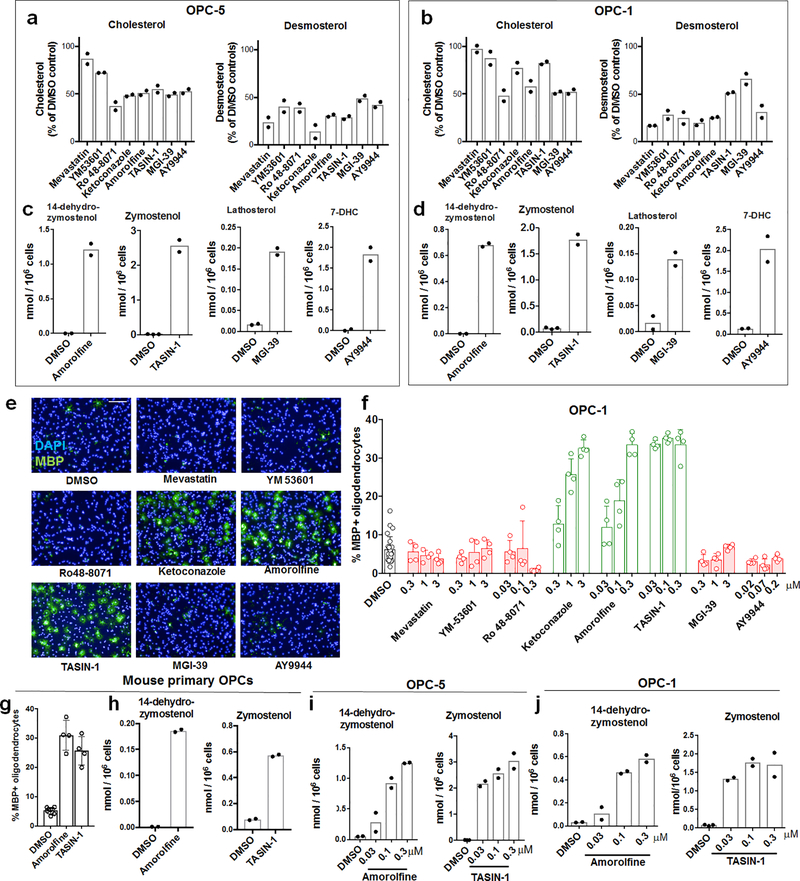
Extended Data Figure 3. Effect of small-molecule inhibition of the cholesterol biosynthesis pathway on enhancing oligodendrocyte formation.
a) GC/MS-based quantitation of sterol levels in OPCs (OPC-5) treated 24 h with the indicated inhibitors of cholesterol biosynthesis. Left, cholesterol; right, desmosterol. n = 2 wells per condition. Inhibitors were used at the following doses unless otherwise noted: mevastatin, ketoconazole, MGI-39, 2.5 μM; YM53601, 2 μM; Ro 48–8071, amorolfine, TASIN-1, 100 nM; AY9944, 200 nM. b) GC/MS-based quantitation of sterol levels in a second derivation of OPCs (OPC-1). Left, cholesterol; right, desmosterol. n = 2 wells per condition. c) GC/MS-based quantitation of the sterol intermediates expected to accumulate following treatment of OPCs with the indicated inhibitors of cholesterol biosynthesis for 24 h. n = 2 wells per condition. d) GC/MS-based quantitation of the sterol intermediates expected to accumulate following treatment of a second derivation of OPCs (OPC-1) with the indicated inhibitors of cholesterol biosynthesis for 24 h. n = 2 wells per condition. In c and d, no accumulation of other sterol intermediates indicative of off-target effects within the cholesterol pathway were observed (see Source Data). e) Representative images of OPC-5 cells treated 72 h with the indicated small molecules. All treatments are at the highest concentration shown in Fig. 2b. Scale bar, 100 μm. f) Percentage of MBP+ oligodendrocytes generated from a second batch of OPCs (OPC-1) at 72 h following treatment with the indicated cholesterol pathway inhibitors. n = 4 wells per condition, except DMSO, n = 24, with > 1,000 cells analyzed per well. g) Percentage of MBP+ oligodendrocytes generated from mouse primary OPCs at 72 h following treatment with the indicated cholesterol pathway inhibitors at 300 nM. n = 4 wells per condition, except DMSO, n = 8, with > 1,000 cells analyzed per well. h) GC/MS-based quantitation of sterol intermediate levels in mouse primary OPCs treated 24 h with the indicated inhibitors of cholesterol biosynthesis at 300 nM. Left, 14-dehydrozymostenol levels following treatment with amorolfine; Right, zymostenol levels following treatment with TASIN-1. n = 2 wells per condition. i, j) GC/MS-based quantitation of sterol intermediate levels in OPC-5 (i) and OPC-1 (j) treated 24 h with the indicated doses of inhibitors of cholesterol biosynthesis. Left, 14-dehydrozymostenol levels following treatment with amorolfine; Right, zymostenol levels following treatment with TASIN-1. n = 2 wells per condition. Concentrations shown in panel i mirror those shown in panel f. All bar graphs indicate mean +/− standard deviation, and panels a, c, e-h are representative of two independent experiments.

